Populations worldwide are exposed to a myriad of chemicals via drinking water, yet only a handful of chemicals have been extensively evaluated with regard to human exposures and health impacts [1, 2]. Many chemicals are generally “invisible” in that they do not alter the color or odor of drinking water, and many of the associated effects are not observable for decades, making linkages between exposure and disease difficult. The articles included in the Journal of Exposure Science and Environmental Epidemiology Special Topic “Assessing Exposure and Health Consequences of Chemicals in Drinking Water in the 21st Century” cover a range of topics, including: (i) new exposure and health research for regulated and emerging chemicals, (ii) new methods and tools for assessing exposure to drinking water contaminants, (iii) issues of equity and environmental justice, (iv) drinking water issues within the context of a changing climate. This Special Topic includes articles authored by experts across multiple disciplines including environmental engineering, hydrology, exposure science, epidemiology, toxicology, climate science, and others. Many of these papers emerged from an international symposium organized by ISGlobal and Yale scientists held in Barcelona in September 2022 [3].
Regulated chemicals
Chemicals that have been the focus of environmental health research include disinfection by-products (DBPs), nitrate, and metals. Although many of these chemicals are regulated, there is concern about low-dose exposures at concentrations below standards and guidelines, and risks of health endpoints not yet studied. Kaufman et al. explore new ways to assess DBP exposure, considering concentrations and specific toxicity potential in relation to birth defects risk [4]. Long-term exposure to DBPs and nitrate is addressed by Donat-Vargas et al. in relation to chronic lymphocytic leukaemia in Spain [5]. Friedman et al. examine temporal and spatial variability of manganese concentrations in a case study in the United States (US) [6]. Hefferon et al. evaluated sociodemographic inequalities in fluoride concentrations across the US [7]. Spaur et al. evaluate the contribution of water arsenic to biomarker levels in a prospective study in the US [8].
Chemicals of emerging concern
Many emerging chemicals, such as per- and polyfluoroalkyl substances (PFAS), microplastics, and 1,4-dioxane, have drinking water as the dominant exposure pathway for many populations. Yet, these remain largely unregulated or have standards and guidelines that vary widely across states and countries. Because only small percentages of the universe of contaminants are regulated in drinking water, routine monitoring data for many chemicals of emerging concern is frequently absent or very limited. To advance understanding of drinking water exposures to PFAS, Cserbik et al. [9]. and Kotlarz et al. [10]. evaluate and compare PFAS in drinking water and blood serum samples in two different settings: an urban setting not impacted by PFAS pollution in Spain [9] and among well water users living near a fluorochemical facility in the US [10], respectively.
New methods and tools for exposure assessment
There is a need for improved tools, methods, and data to evaluate drinking water related exposures. These tools and techniques remain somewhat limited and lag behind those of other stressors (e.g., air pollution). Also, despite water contaminants occurring in mixtures, most of the evaluations (and policies and regulations) are conducted chemical by chemical, ignoring potential interactions. Schullehner et al. present case studies of three approaches of exposure assessment of drinking water quality: use of country-wide routine monitoring databases, wide-scope chemical analysis, and effect-based bioassay methods [11]. Luben et al. elaborate and compare different exposure assessment metrics to trihalomethanes in epidemiological analyses of reproductive and developmental outcomes [12]. Escher et al. present in vitro assays to evaluate biological responses of including neurotoxicity, oxidative stress, and cytotoxicity in different types of drinking water samples (tap, bottled, filtered) [13] Isaacs et al. present newly developed automated workflows to screen contaminants of concern based on toxicity and exposure potential [14]. Dorevitch et al. develop a novel method to improve detection of particulate lead spikes [15].
Issues of equity, environmental justice, and vulnerable populations
A substantial portion of the population (e.g., 20% in the United States) have private water supplies (e.g., a household domestic drinking water well), which are not subject to any federal regulatory oversight or monitoring [16]. This presents an equity issue in access to data on drinking water quality, as discussed in Levin et al. [2]. and heterogeneity in state-based policies for drinking water prevention, as discussed by Schmitt et al. [17]. Spaur et al. [8], observed that water from unregulated private wells and regulated municipal water supplies contributes substantially to overall exposures (as measured by urinary arsenic and uranium concentrations) in both rural, American Indian populations and urban, racially/ethnically diverse populations nationwide. Hefferon et al. evaluated environmental justice issues with respect to fluoride and found that 2.9 million US residents are served by public water systems with average fluoride concentrations exceeding the World Health Organization’s guidance limit [7]. Friedman et al. show that manganese in drinking water frequently exceeds current guidelines in the US, and occur at concentrations shown to be associated with adverse health outcomes, especially for vulnerable and susceptible populations like children [6].
Chemical contamination may also pose a serious threat in the developing world. Today, around 2.2 billion people – or 1 in 4 – still lack safely managed drinking water at home [18]. In most of the world, microbial contamination is the biggest challenge. Because it has been understudied, the chemical risks remain obscure [19], and regulators often require local data to take action. Praveena et al. reviews the quality of different drinking water types in Malaysia (tap water, ground water, gravity feed system) and its implications on policy, human health, management, and future research [20].
Water quality in a changing climate
There is an urgent need to anticipate and prepare for current and future challenges in a rapidly changing world. We also need to foresee new challenges to address issues of water scarcity (e.g., increasing desalination, use of treated wastewater in densely populated urban areas to meet water use demands), and aging infrastructure for many middle- and high-income countries constructed in the nineteenth and twentieth centuries. The impacts of climate change on the water cycle are direct and observable, such as more frequent droughts and floods, sea level rise, and ice/snow melt. These events will challenge drinking water quality and availability through direct and indirect mechanisms [21]. There is still very limited knowledge on how climate events will affect the quality of finished drinking water. In our special issue, Oliveras et al. conducts a new analysis on the impacts of drought and heavy rain surrogates on the quality of drinking water in Barcelona, Spain [22].
Conclusion
Chemical contamination of drinking water is widespread. Although our knowledge on chemical risks in drinking water is increasing, there are knowledge gaps that make a slow translation to public health protection. We hope this issue highlights, elevates, and motivates research on chemical exposures via drinking water.
Background: Warming caused by climate change can impact human health risks associated with drinking water. This review aimed to synthesize the evidence about the effects of increasing temperatures in the drinking water distribution system (DWDS) on health-related chemical and microbial water quality parameters. We also identified adaptation options. Methods: We conducted a scoping review of quantitative peer-reviewed studies published up to March 2023, and research reports published up to April 2024, specifically looking at a DWDS or comparable experimental conditions. Results: We included 28 studies in this review. Evidence focused on chlorinated systems in higher-income countries. Warming has variable effects on microbial communities within the DWDS. Accumulation and release of heavy metals may increase at higher temperatures, depending on pipe materials. Warming also speeds up the decay of chlorine and chloramine, affecting the formation of disinfectant byproducts and the potential of microbial (re)growth. Multiple effects can occur simultaneously, requiring an integrated adaptation approach. Technical and institutional adaptation options, such as improved removal of dissolved organic carbon during treatment covering the entire DWDS were identified. Discussion: With increasing climate change, the identified effects can become more prominent without adaptation. However, no included studies quantified how these effects would translate into human health impacts.
Scientists estimate that bottled water drinkers swallow up to 90,000 more microplastic particles per year than those who stick to tap water.
Source:Concordia University
Summary:A chance encounter with plastic waste on a tropical beach sparked a deep investigation into what those fragments mean for human health. The research reveals that bottled water isn’t as pure as it seems—each sip may contain invisible microplastics that can slip through the body’s defenses and lodge in vital organs. These tiny pollutants are linked to inflammation, hormonal disruption, and even neurological damage, yet remain dangerously understudied.Share:
FULL STORY
Recent research has revealed that people may be unknowingly ingesting tens of thousands of microplastic particles every year. On average, individuals consume between 39,000 and 52,000 particles annually, with bottled water drinkers taking in an additional 90,000 microplastic fragments compared to those who drink tap water. Credit: Shutterstock
Thailand’s Phi Phi Islands are known for their crystal-clear waters and white sand, not for launching advanced scientific research. Yet for one environmental scientist, the contrast between natural beauty and pollution sparked a major career shift from business to environmental science.
“I was standing there looking out at this gorgeous view of the Andaman Sea, and then I looked down and beneath my feet were all these pieces of plastic, most of them water bottles,” she says.
“I’ve always had a passion for waste reduction, but I realized that this was a problem with consumption.”
Armed with years of experience as co-founder of ERA Environmental Management Solutions, a company specializing in environmental, health and safety software, she returned to Concordia University to pursue a PhD on plastic waste. Her recent paper in the Journal of Hazardous Materials explores how single-use plastic water bottles pose potential health risks that remain largely overlooked in scientific research.
Hidden Hazards of Bottled Water
In an extensive review of more than 140 studies, the research reveals that people consume between 39,000 and 52,000 microplastic particles every year, and those who drink bottled water take in roughly 90,000 more than tap water users.
These microplastics are tiny fragments, often invisible to the eye. A typical particle measures between one micron (a thousandth of a millimeter) and five millimeters, while nanoplastics are even smaller. The contamination begins during manufacturing, transportation, and storage, when low-quality plastics release microscopic fragments — especially when exposed to sunlight and fluctuating temperatures. Unlike microplastics from food sources, those in bottled water are ingested directly.
Inside the Human Body
Once consumed, these particles can travel throughout the body. Studies indicate that microplastics can cross biological barriers, enter the bloodstream, and accumulate in organs. This may cause chronic inflammation, oxidative stress, hormonal disruption, reproductive impairment, neurological issues, and even some cancers. However, the long-term impact remains uncertain due to limited standardized testing and measurement techniques.
The researcher highlights that current detection tools vary in precision and capability. Some methods can spot smaller particles but cannot identify their composition, while others analyze chemical makeup but miss the tiniest plastics. The most advanced systems are both expensive and difficult to access, hindering consistent global study.
Rethinking Plastic Use Through Education
Despite growing environmental laws aimed at reducing plastic pollution, most regulations target items like shopping bags, straws, and packaging. Single-use water bottles often escape similar scrutiny.
“Education is the most important action we can take,” she says. “Drinking water from plastic bottles is fine in an emergency but it is not something that should be used in daily life. People need to understand that the issue is not acute toxicity — it is chronic toxicity.”
Chunjiang An, associate professor, and Zhi Chen, professor, in the Department of Building, Civil and Environmental Engineering at the Gina Cody School of Engineering and Computer Science contributed to this paper.
This research was supported by the Natural Sciences and Engineering Research Council of Canada and Concordia University.
In 2021, over 2 billion people live in water-stressed countries, which is expected to be exacerbated in some regions as result of climate change and population growth (1).
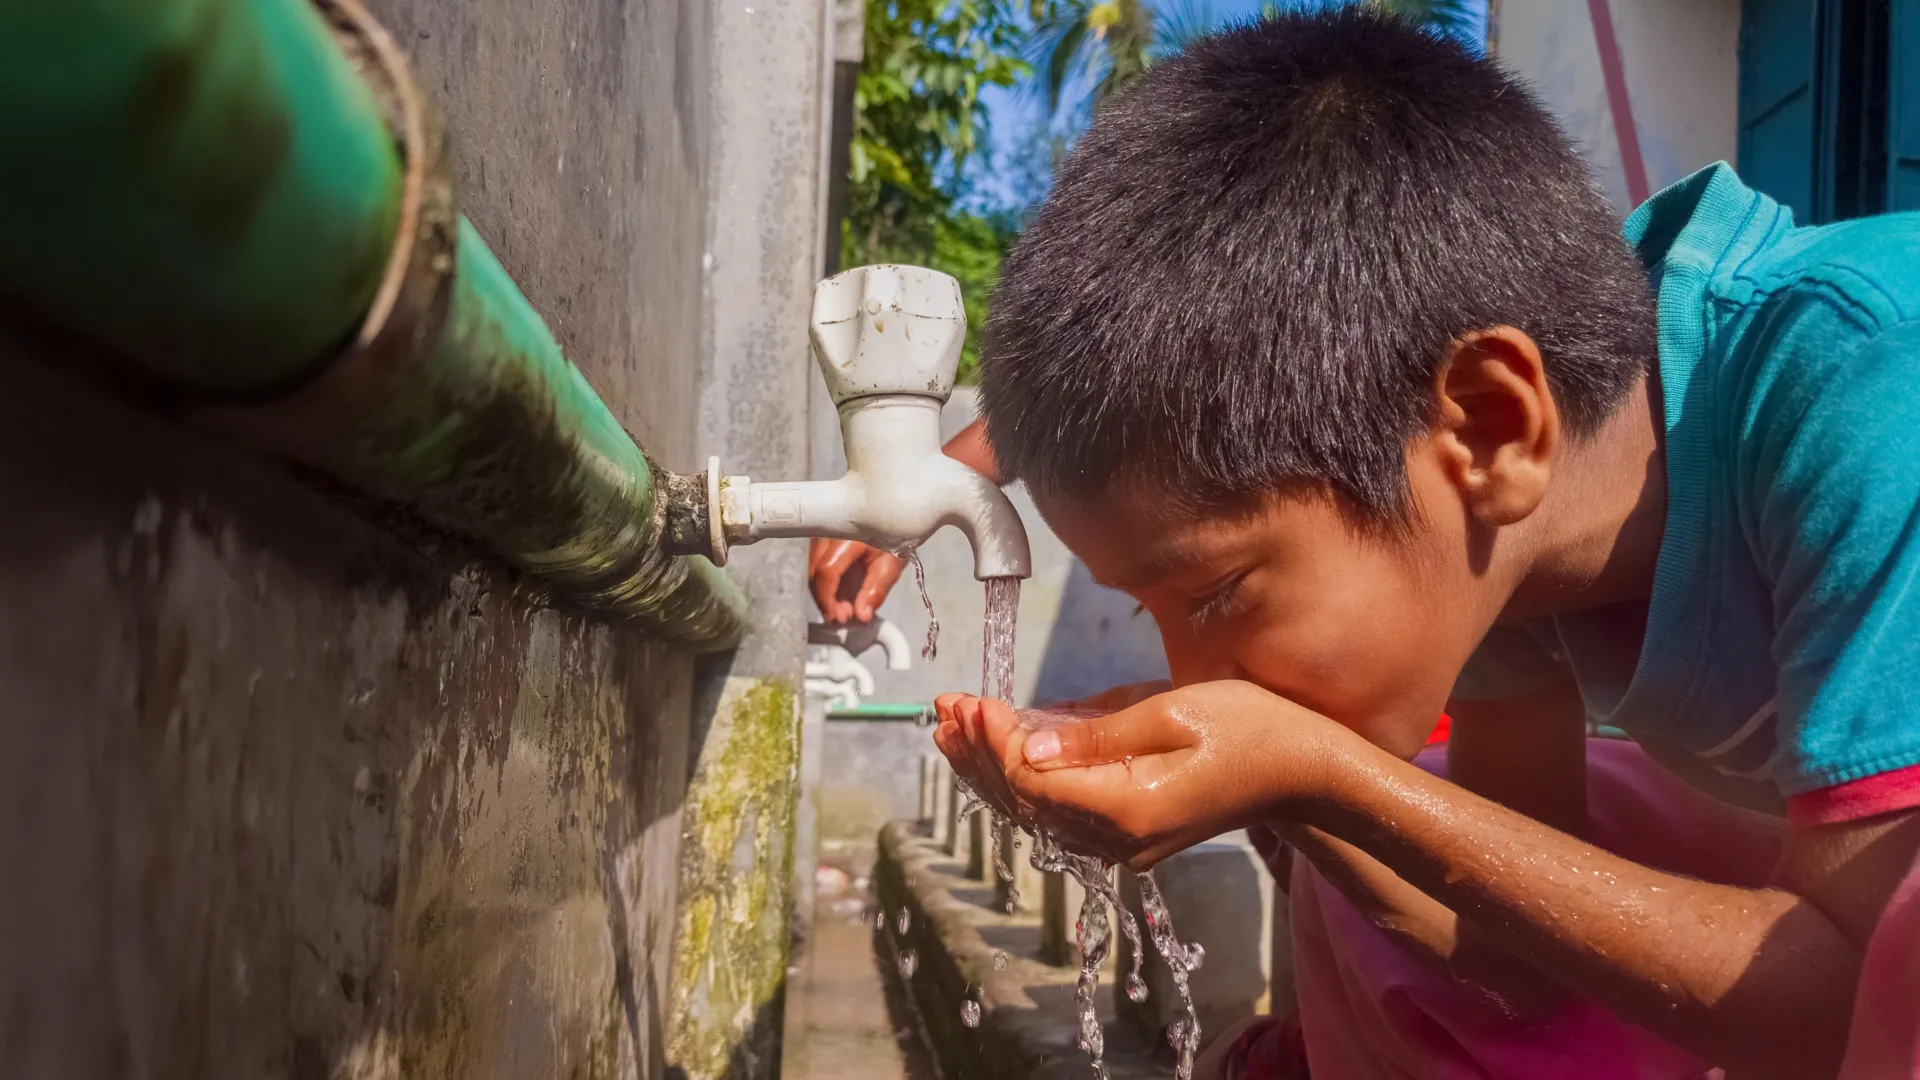
In 2022, globally, at least 1.7 billion people use a drinking water source contaminated with faeces. Microbial contamination of drinking-water as a result of contamination with faeces poses the greatest risk to drinking-water safety.
Safe and sufficient water facilitates the practice of hygiene, which is a key measure to prevent not only diarrhoeal diseases, but acute respiratory infections and numerous neglected tropical diseases.
Microbiologically contaminated drinking water can transmit diseases such as diarrhoea, cholera, dysentery, typhoid and polio and is estimated to cause approximately 505 000 diarrhoeal deaths each year.
In 2022, 73% of the global population (6 billion people) used a safely managed drinking-water service – that is, one located on premises, available when needed, and free from contamination.
Overview
Safe and readily available water is important for public health, whether it is used for drinking, domestic use, food production or recreational purposes. Improved water supply and sanitation, and better management of water resources, can boost countries’ economic growth and can contribute greatly to poverty reduction.
In 2010, the UN General Assembly explicitly recognized the human right to water and sanitation. Everyone has the right to sufficient, continuous, safe, acceptable, physically accessible and affordable water for personal and domestic use.
Drinking-water services
Sustainable Development Goal target 6.1 calls for universal and equitable access to safe and affordable drinking water. The target is tracked with the indicator of “safely managed drinking water services” – drinking water from an improved water source that is located on premises, available when needed, and free from faecal and priority chemical contamination.
In 2022, 6 billion people used safely managed drinking-water services – that is, they used improved water sources located on premises, available when needed, and free from contamination. The remaining 2.2 billion people without safely managed services in 2022 included:
1.5 billion people with basic services, meaning an improved water source located within a round trip of 30 minutes;
292 million people with limited services, or an improved water source requiring more than 30 minutes to collect water;
296 million people taking water from unprotected wells and springs; and
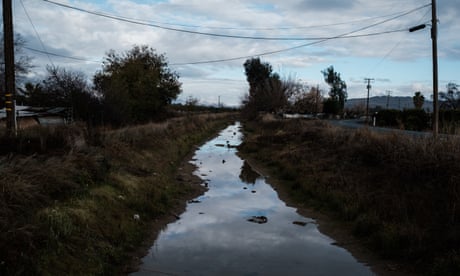
115 million people collecting untreated surface water from lakes, ponds, rivers and streams.
Sharp geographic, sociocultural and economic inequalities persist, not only between rural and urban areas but also in towns and cities where people living in low-income, informal or illegal settlements usually have less access to improved sources of drinking-water than other residents.
Water and health
Contaminated water and poor sanitation are linked to transmission of diseases such as cholera, diarrhoea, dysentery, hepatitis A, typhoid and polio. Absent, inadequate, or inappropriately managed water and sanitation services expose individuals to preventable health risks. This is particularly the case in health care facilities where both patients and staff are placed at additional risk of infection and disease when water, sanitation and hygiene services are lacking.
Out of every 100 patients in acute-care hospitals, 7 patients in high-income countries (HICs) and 15 patients in low- and middle-income countries (LMICs) will acquire at least one health care-associated infection during their hospital stay.
Inadequate management of urban, industrial and agricultural wastewater means the drinking-water of hundreds of millions of people is dangerously contaminated or chemically polluted. Natural presence of chemicals, particularly in groundwater, can also be of health significance, including arsenic and fluoride, while other chemicals, such as lead, may be elevated in drinking-water as a result of leaching from water supply components in contact with drinking-water.
Some 1 million people are estimated to die each year from diarrhoea as a result of unsafe drinking-water, sanitation and hand hygiene. Yet diarrhoea is largely preventable, and the deaths of 395 000 children aged under 5 years could be avoided each year if these risk factors were addressed. Where water is not readily available, people may decide handwashing is not a priority, thereby adding to the likelihood of diarrhoea and other diseases.
Diarrhoea is the most widely known disease linked to contaminated food and water but there are other hazards. In 2021, over 251.4 million people required preventative treatment for schistosomiasis – an acute and chronic disease caused by parasitic worms contracted through exposure to infested water.In many parts of the world, insects that live or breed in water carry and transmit diseases such as dengue fever. Some of these insects, known as vectors, breed in clean, rather than dirty water, and household drinking water containers can serve as breeding grounds. The simple intervention of covering water storage containers can reduce vector breeding and may also reduce faecal contamination of water at the household level.
Economic and social effects
When water comes from improved and more accessible sources, people spend less time and effort physically collecting it, meaning they can be productive in other ways. This can also result in greater personal safety and reducing musculoskeletal disorders by reducing the need to make long or risky journeys to collect and carry water. Better water sources also mean less expenditure on health, as people are less likely to fall ill and incur medical costs and are better able to remain economically productive.
With children particularly at risk from water-related diseases, access to improved sources of water can result in better health, and therefore better school attendance, with positive longer-term consequences for their lives.
Challenges
Historical rates of progress would need to double for the world to achieve universal coverage with basic drinking water services by 2030. To achieve universal safely managed services will require a 6-fold increase. Climate change, increasing water scarcity, population growth, demographic changes and urbanization already pose challenges for water supply systems. Over 2 billion people live in water-stressed countries, which is expected to be exacerbated in some regions as result of climate change and population growth. Re-use of wastewater to recover water, nutrients or energy is becoming an important strategy. Use of wastewater and sludge is widespread globally; however, much is used informally and/or without sufficient treatment and other controls to ensure that human and environmental health is protected. If done appropriately safe use of wastewater and sludge can yield multiple benefits, including increased food production, increased resilience to water and nutrient scarcity and greater circularity in the economy.
Options for water sources used for drinking-water and irrigation will continue to evolve, with an increasing reliance on groundwater and alternative sources, including wastewater. Climate change will lead to greater fluctuations in harvested rainwater. Management of all water resources will need to be improved to ensure provision and quality.
WHO’s response
As the international authority on public health and water quality, WHO leads global efforts to prevent water-related disease, advising governments on the development of health-based targets and regulations.
WHO produces a series of water quality guidelines, including on drinking-water, safe use of wastewater, and recreational water quality. The water quality guidelines are based on managing risks, and since 2004 the Guidelines for drinking-water quality promote the Framework for safe drinking-water. The Framework recommends establishment of health-based targets, the development and implementation of water safety plans by water suppliers to most effectively identify and manage risks from catchment to consumer, and independent surveillance to ensure that water safety plans are effective and health-based targets are being met.
The drinking-water guidelines are supported by background publications that provide the technical basis for the Guidelines recommendations. WHO also supports countries to implement the drinking-water quality guidelines through the development of practical guidance materials and provision of direct country support. This includes the development of locally relevant drinking-water quality regulations aligned to the principles in the Guidelines, the development, implementation and auditing of water safety plans and strengthening of surveillance practices.
Since 2014, WHO has been testing household water treatment products against WHO health-based performance criteria through the WHO International Scheme to Evaluate Household Water Treatment Technologies. The aim of the scheme is to ensure that products protect users from the pathogens that cause diarrhoeal disease and to strengthen policy, regulatory and monitoring mechanisms at the national level to support appropriate targeting and consistent and correct use of such products.
WHO works closely with UNICEF in a number of areas concerning water and health, including on water, sanitation, and hygiene in health care facilities. In 2015 the two agencies jointly developed WASH FIT (Water and Sanitation for Health Facility Improvement Tool), an adaptation of the water safety plan approach. WASH FIT aims to guide small, primary health care facilities in low- and middle-income settings through a continuous cycle of improvement through assessments, prioritization of risk, and definition of specific, targeted actions. A 2023 report describes practical steps that countries can take to improve water, sanitation and hygiene in health care facilities.
It was an ideal spot for families to swim and fish
Then Wisconsin officials tested the water
Snowden Lake in Stella, Wis., seen here on Oct. 20, 2025, has been contaminated with PFAS, known commonly as forever chemicals. (AP Photo/Michael Phillis)
STELLA, Wis. (AP) — Kristen Hanneman made a small decision in 2022 that would upend life for her entire town.
State scientists were checking private drinking water wells across Wisconsin for a widely used family of harmful chemicals called PFAS. They mailed an offer to test the well outside her tidy farmhouse surrounded by potato farms cut out of dense forest. Without much thought, she accepted.
Months later, Hanneman found herself on the phone with a state toxicologist who told her to stop drinking the water — now. The well her three kids grew up on had levels thousands of times higher than federal drinking water limits for what are commonly known as forever chemicals.
Hanneman’s well was hardly the only one with a problem. And the chemicals were everywhere. Pristine lakes and superb hunting made Stella a sportsman’s dream. Now officials say the fish and deer should be eaten sparingly or not at all.
Many residents here have known their neighbors for decades. If they want to move away from all this, it’s hard to sell their property – who, after all, would want to buy?
“Had I just thrown that survey in the garbage,” Hanneman said, “would any of this be where it is today?”
The town hall in Stella, Wis., on Friday, Dec. 5, 2025. (AP Photo/Morry Gash)
Stella is far from the only community near industrial sites and military bases nationwide where enormous amounts of PFAS have contaminated the landscape, posing a particular threat to nearby well owners.
Forever chemicals get their name because they resist breaking down, whether in well water or the environment. In the human body, they accumulate in the liver, kidneys and blood. Research has linked them to an increased risk of certain cancers and developmental delays in children.
Government estimates suggest as much as half of U.S. households have some level of PFAS in their water — whether it comes from a private well or a tap. But while federal officials have put strict limits on water provided by utilities, those rules don’t apply to the roughly 40 million people in the United States who rely on private drinking water wells.
Short of a random test, as in Stella, few may learn their water is tainted with the odorless, colorless chemicals.
At least 20 states do not test private wells for PFAS outside of areas where problems are already suspected, according to a survey of state agencies by The Associated Press. Even in states that do, residents often wait years for help and receive far fewer resources than people tied into municipal tap water.
PFAS are so common because they are so useful. Uniquely able to repel moisture and withstand extreme temperatures, the chemicals have been critical to making waterproof shoes, nonstick cookware and foam that could extinguish the hottest fires.
When the chemicals reach soil or water, as they have near factories and waste sites, they are extremely difficult to remove. North Carolina saw an early example, with well owners downstream from a PFAS manufacturing plant still dealing with tainted water years later. In rural northwest Georgia, communities are reckoning with widespread contamination from PFAS that major carpet manufacturers applied for stain resistance.
Robert Bilott, an environmental attorney who pursued one of the first major lawsuits against a PFAS manufacturer in the late 1990s, said many states don’t have the money to help.
“The well owners — the victims of the contamination — shouldn’t have to be paying,” he said. “But where’s this money going to come from?”
Attendees listen to presentations at the Chatsworth, Ga., town hall on Thursday, June 12, 2025. The group PFAS Georgia represents numerous residents and farmers in Dalton and Calhoun who allege their properties are contaminated with PFAS from the carpet industry. (Hyosub Shin/Atlanta Journal-Constitution via AP)Marie Jackson mows her lawn, Thursday, May 8, 2025, in Resaca, Ga. She spent her childhood playing and swimming in the Conasauga River, downstream from Dalton. Her idyllic memories are overshadowed by recollections of foam on the river and dead fish. (Hyosub Shin/Atlanta Journal-Constitution via AP)
Well owners often the last to know about contamination
The alarming results from Hanneman’s well triggered a rush of testing, beginning with the wells of nearby neighbors and later expanding miles away.
How the chemicals infiltrated water beneath Stella’s sandy soil was initially a mystery. State officials eventually suspected the paper mill in the small city of Rhinelander, a 10-mile (16-kilometer) drive from town. The mill had specialized in making paper for microwave popcorn bags — a product that was greaseproof thanks in part to PFAS.
The mill’s manufacturing process also produced a waste sludge which could be used as a fertilizer. By 1996, and for decades after with state approval, the mill spread millions of pounds on farm fields in and around Stella. Wisconsin officials now believe the PFAS it contained seeped into the subterranean reserves of groundwater that feed lakes, streams and many residential wells.
In September, the state sent initial letters assigning cleanup and investigation responsibilities to current and former owners of the mill. These companies point out that the state permitted their sludge spreading, starting long before the dangers of PFAS were widely understood.
The Ahlstrom paper mill in Rhinelander, Wis., on Friday, Dec. 5, 2025 (AP Photo/Morry Gash)
The problem in Stella remained hidden because well owners don’t have a utility testing their water.
Rhinelander’s water utility first tested for PFAS in 2013 to comply with federal rules. By 2019, the city shut down two utility-owned public wells to protect customers. In Stella, meanwhile, some well owners found out only last year that their water is unsafe.
The Hanneman family moved into their home when their oldest son was nearly two. He’s 19 now. His parents worry about all those years of exposure, and have joined an effort to sue the paper mill’s owners and PFAS manufacturers.
Several plaintiffs in the growing lawsuit allege property damage and that their cholesterol, thyroid and kidney diseases are linked to contaminated groundwater. The companies have denied responsibility.
Very tiny amounts of PFAS consumed regularly over years can be dangerous. As scientists better understood those risks, federal advice for water utilities slowly followed and tightened. The current limit is just 4 parts per trillion, or less than a drop diluted in an Olympic-size swimming pool.
The Environmental Protection Agency recommends private wells be tested for bacteria and a limited number of commonly found chemicals, but not PFAS unless it is a known local problem. Experts say testing mandates would be deeply unpopular. Many well owners value their freedom from government oversight and a monthly bill, and take pride in the taste of their water.
PFAS has turned some of those freedoms into liabilities. The chemicals can only be removed from water with costly filters that must be regularly monitored and replaced. Some well owners opt instead to drill deeper or even connect to city water pipes. Facing expensive and uncertain options, many resort to bottled water.
Tom LaDue baits a hook with his grandkids in 2022 before PFAS contamination was discovered in Snowden Lake in Stella, Wis. (Courtesy Tom LaDue via AP)
In Stella, residents are grappling with the chemicals’ unpredictable underground path. Though Tom LaDue’s backyard extends to the edge of a highly contaminated lake, testing found barely any PFAS in his family’s well.
Somehow, a neighbor farther back from the lake found 1,500 parts per trillion of PFAS in her shallower well — magnitudes above the federal limits for tap water. The mother of three in that house says she is regularly tired, which she blames on thyroid issues, wondering if the water is to blame.
In one picture from a few years ago, LaDue is baiting a hook as his grandson dangles a fishing pole over the side of their boat. The sun shines bright.
“It’s a nice lake and we fished in here,” he said. “Now they tell us we can’t eat the fish anymore.”
House by house
While utilities can rely on centralized treatment facilities, restoring safe water for well owners must be done household by household. Some well owners get left out as regulators, lawyers and companies strike deals over who gets help.
The treatment of residents in the lakeside town of Peshtigo, Wisconsin, depends on the street where they live.
The town faced a crisis nearly a decade ago when PFAS were detected in wells downstream from a fire technology plant owned by Tyco and parent company Johnson Controls, which manufactured firefighting foam. Wisconsin officials said the company was responsible for cleaning up the plant and must sample wells in a broad area to see where the pollution spread. Johnson Controls told state regulators it studied the area’s hydrology and geology and concluded it would pay for tests and drill new wells in a smaller section of town for which it maintains it is responsible.
Kayla Furton, a high school teacher who grew up in Peshtigo, lives in a home inside this area.
Had she lived two houses away, Furton would have had to pay out of pocket to treat the PFAS in her water.
Furton’s worries over what would happen to her neighbors beyond that line, including her sister, motivated her to run for the town’s board. During her time in office, Peshtigo leadership split over which fixes to pursue, and some well owners are still waiting on a long-term solution.
“Groundwater does not follow lines drawn on a map,” Furton said. “There’s nothing to say that, OK, the PFAS stops there.”
In a statement, Johnson Controls said it has taken full responsibility for the area it contaminated. The company said it has restored more than 300 million gallons of clean water to the environment and installed 139 new wells.
The state of Wisconsin says the company has not fully investigated the extent of the contamination, and filed a lawsuit in 2022. Johnson Controls said in December the parties were close to reaching an agreement; the Wisconsin Department of Justice said it does not comment on pending litigation.
The Cape Fear River flows over Lock and Dam No. 1 at Riegelwood, N.C., on Jan. 18, 2025. (AP Video/Carolyn Kaster)
Residents along the Cape Fear River in North Carolina have seen just how far forever chemicals can spread. In 2017, the Wilmington StarNews revealed that PFAS from a Chemours chemical plant in Fayetteville were washing into the river and contaminating the water supply. After being sued, the billion-dollar company agreed to test nearby wells and treat those with polluted water. It did not admit to any wrongdoing.
As in Stella, the company tested in a slowly expanding radius that grew by quarter-mile segments from its plant. Chemours agreed to keep testing wells until it reached the edge of the polluted area — a process it expected to take 18 months.
Seven years and some 23,000 wells later, testing is ongoing, with the contamination stretching far beyond what state regulators first imagined. Forever chemicals have been found in drinking water along nearly 100 miles (160 kilometers) of the river, from inland Fayetteville to the Atlantic coast.
According to an AP analysis of data submitted to the state’s Department of Environmental Quality, Chemours discovered high levels of PFAS in more than 150 new wells in 2025.
Many well owners “thought they were fine,” said Emily Donovan, an organizer and cofounder of the group Clean Cape Fear. “And now they’re finding out so late that they were also contaminated.”
The Chemours Company, Fayetteville Works in White Oak, N.C., on Tuesday, Dec. 9, 2025. (AP Photo/Carolyn Kaster)A sign at the entrance of Chemours’ Fayetteville Works in White Oak, N.C., on Tuesday, Dec. 9, 2025. (AP Photo/Carolyn Kaster)
In a statement, Chemours said its timeline for testing wells depends on factors outside its control, including whether residents allow it, and that of the roughly 1,250 wells it sampled last year, 12% had PFAS. Chemours said it continues to contact eligible homes, and that a sample is typically taken within a week of residents’ responding.
States leave well owners behind
In the absence of federal rules, responsibility falls to the states. But many states don’t look for contamination in private wells — and when those that do find it, many struggle to fund a fix.
One proactive state is Michigan, where millions rely on private wells. Officials there have tested groundwater and offered free tests to well owners near PFAS hot spots which, at hundreds of dollars per test, many owners are reluctant or unable to buy. The state provided more than $29 million in grants to clean up forever chemicals in its 2022 fiscal year, including hooking up nearly a thousand well owners to public water.
One of the biggest challenges is helping well owners understand why they should take the threat seriously.
“We are very lucky to get 50% of the people to say, ‘Yes, come test my well for free,’ let alone willing to put on a filter,” said Abigail Hendershott, executive director of Michigan’s multiagency team that responds to PFAS contamination.
New Hampshire, which dealt with an early PFAS crisis in Merrimack, has tested over 15,000 wells, more than half of which had levels exceeding federal standards. It provides generous rebates for homeowners to access clean water.
Elsewhere, millions of households are left on their own.
In northwest Georgia, some of the world’s largest carpet companies began applying PFAS for stain resistance in the 1970s. The companies continued using the chemicals, which entered the environment through manufacturing wastewater, for years, even after scientific studies and regulators warned of their accumulation in human blood and possible health effects, according to an investigation by The Atlanta Journal-Constitution, The Associated Press, The Post and Courier and AL.com. The companies say that they followed all required regulations and that they stopped using PFAS on carpets in 2019.
Faye Jackson gets her blood tested at a medical clinic in Calhoun, Ga., on Tuesday, Sept. 30, 2025, as her daughter Marie waits outside for her turn. Their blood tests revealed they have PFAS levels above the safety threshold outlined by national health experts. (Miguel Martinez/Atlanta Journal-Constitution via AP)
The chemicals have tainted much of the landscape, including the drinking water in cities and the waterways that crisscross the Conasauga River watershed, home to tens of thousands of people. But only well owners near the small city of Calhoun have been offered free tests, and then only under a court agreement. The contaminated river flows into Alabama, where state officials do not typically test private wells for PFAS.
Financial limitations are an oft-cited reason why states aren’t doing more.
Wisconsin, which relied on federal funds for its initial survey of wells, has scraped together resources to investigate PFAS in Stella. The state’s environmental agency has no budget for sampling or treatment and is pulling money and staff time from other programs, according to the head of the drinking and groundwater program. Supplying bottled water to impacted homes — once a rare expense — now requires the state to set aside $900,000 annually.
Meanwhile, enormous amounts of money that could help have been stuck in a bank account, collecting interest. Though state lawmakers voted in 2023 to provide $125 million for PFAS cleanup, the funding has been mired by a separate debate over whether to shield certain property owners from liability. In January, key legislators said they were getting closer to a deal that would release the money.
The EPA has allocated billions to states for PFAS treatment and testing, but much of that money goes to public utilities.
Construction is underway on a reverse osmosis treatment facility which is designed to filter out PFAS from local drinking water in Gadsden, Ala., on Wednesday, Nov. 19, 2025. (Will McLelland/AL.com/The Birmingham News via AP)
Federal officials are evaluating Stella for inclusion in the Superfund program, a large-scale decontamination process that would take years. They also partnered with Wisconsin officials to expand well sampling in July.
At an October public meeting in Stella, several residents asked if they should be worried about their well water.
There is a risk, state employees said, but they could not offer unlimited free tests to rule it out. Those who wanted one immediately would have to pay for it.
“We’re doing the best that we can with the funding that we have available,” said Mark Pauli, a drinking and groundwater supervisor.
In a statement, a spokesperson for the Wisconsin Department of Natural Resources said it had offered cost-free PFAS sampling for well owners within three miles of Stella and to many beyond that distance. The state said it provides owners of contaminated wells with guidance on treating their water and accessing financial help.
Nobody is accepting blame in Stella and finger pointing is circular. While the state is investigating, the current and former mill owners point to the state’s permit as exonerating and say they followed all state rules.
Ahlstrom, the Finnish company that has owned the mill since 2018, said in a statement it hasn’t used two of the most common types of PFAS found in Stella wells in its manufacturing process, and that it phased out all other types of PFAS in 2023. In late January, the company announced its own free bottled water program for residents.
Former owner Wausau Paper and its parent company Essity said they were cooperating with state officials and that the waste sludge they spread was tested for various contaminants, but not PFAS because it wasn’t required.
Wisconsin officials say the threat of PFAS in the sludge wasn’t well understood when they approved its use as fertilizer, and that the state will continue to require those who caused contamination to address its impacts.
That leaves residents, who did not contaminate their own wells, stuck hiring lawyers who argue these companies and PFAS manufacturers knew — or should have known — the risks.
A new normal in Stella
The crisis in Stella sparked by the test of her own well drove Kristen Hanneman to run for a town leadership role.
She spent months learning about the dangers of PFAS, then relaying that knowledge. It’s a town so small that she said talking to a few of the right people would spread word to just about everyone.
It’s been more than three years since Hanneman learned her well had PFAS levels near 11,500 parts per trillion. Federal limits are in the single digits. Her water supply is just as contaminated now as it was then. The family currently drinks and cooks with bottled water provided by the state.
Though some Stella residents have been able to access grant funding to drill deeper wells to reach clean water, the help was limited by household income, with some families disqualified if they made more than $65,000. Typically, the most a family could receive was $16,000 — about half of what it may cost for a replacement well.
Stories circulate in Stella about people who paid for a new well only for their water still to be contaminated. Wisconsin state officials confirmed that at least three households faced this dilemma.
“Do we spend $20,000 to $40,000 on a new well for it to still be a problem?” Hanneman said.
One couple said replacing their well cleaned out much of their savings. Many are concerned about how much their home values have dropped.
A grant did help Cindy Deere, who worries about how 25 years of drinking the water in Stella may affect her health. She replaced her well and a test confirmed the new one was PFAS-free. Still, she has a hard time trusting the water.
“It’s a constant worry,” she said. “Is it going to turn bad?”
The paper mill is still permitted to spread sludge in the county that includes Stella. Its PFAS levels have recently tested well within new state guidelines.
Experts said sludge from industry and manufacturers is most likely to contain PFAS. Wisconsin developed testing guidelines for those sources for that reason, officials said.
But the state doesn’t require another type of sludge — treated waste from septic systems, which capture household sewage — to be tested for PFAS. A local septic company has been spreading it in Stella — in 2024 alone, it applied hundreds of thousands of gallons to farms and elsewhere, state records show. The company did not respond to multiple requests for comment.
Dianne Kopec, who has researched PFAS in wastewater at the University of Maine, said that without testing, officials can’t know if the practice recycles the chemicals back onto the soil in Stella.
“Given what we know today, continuing to spread sludge on agricultural fields is ludicrous,” Kopec said. “When you find yourself in a hole, it is best to stop digging.”
Snowden Lake in Stella, Wis., seen on Friday, Dec. 5, 2025, is contaminated by PFAS and officials say the fish is no longer safe to eat. (AP Photo/Morry Gash)
___
Associated Press writers Todd Richmond in Madison, Wis., Jason Dearen in Los Angeles and M.K. Wildeman in Hartford, Conn., contributed. Dylan Jackson and Justin Price of The Atlanta Journal-Constitution contributed from Atlanta.
___
This story is part of an investigative collaboration with The Atlanta Journal-Constitution, The Post and Courier and AL.com. It is supported through AP’s Local Investigative Reporting Program.
___
The Associated Press receives support from the Walton Family Foundation for coverage of water and environmental policy. The AP is solely responsible for all content. For all of the AP’s environmental coverage, visit https://apnews.com/hub/climate-and-environment.
Chlorinating drinking water at levels common in the United States and European Union probably increases the risk of several cancers, a new analysis of recent research from across the globe finds.
The process of disinfecting water with chlorine creates trihalomethane (THM) byproducts, which are found in virtually all public drinking water systems across the US and EU – nearly 300 million people in the US have concerning levels in their water, by one estimate.
While the chlorination process is a “cheap, effective, and readily available” method for killing organisms and infectious disease, it comes with trade-offs, the study’s authors wrote, including a 33% increased risk of bladder cancer and 15% increased risk of colorectal cancer.
“What we see is alarming and we need some more high quality studies,” Emilie Helte, a lead author with Karolinska Institutet in Sweden, said.
The process of disinfecting water is an essential public health measure that dramatically increased life expectancy when the US began chlorinating drinking water in the early 1900s because it significantly reduced microbial infections and waterborne illnesses, like cholera and typhoid fever.
It wasn’t until the 1970s that researchers discovered the process came with consequences. When chlorine is added to water, it reacts with organic compounds, like decaying plant material, to create any number of hundreds of potentially toxic byproducts.
Some of the most common – chloroform, bromoform, bromodichloromethane, and chlorodibromomethane – are known to be genotoxic and carcinogenic to rats.
The US and EU set limits on byproducts at 80 parts per billion (ppb) and 100ppb, respectively, but the new research points to increased cancer risks at levels as low as 40ppb, which is around what they have been found at in New York City. The EPA reports levels are typically in the 40 to 60ppb range and the public health advocacy non-profit Environmental Working Group estimates the safe level at 0.15ppb.
The new meta study is among the most emphatic evidence because it looked at data from about 30 studies and 90,000 participants, and found men were more at risk than women. The authors only looked at bladder and colorectal impacts because there is a dearth of research on other cancers. Researchers are not sure why the chemicals seem to most frequently target the large intestine and bladder, Helte said.
The problem creates a difficult tension for regulators. Surface water typically has higher THM levels than groundwater because it has more organisms and organic matter for the disinfectants to react with. Water utilities could clean some of the organic matter out of the water before disinfecting, and it is also potentially possible to lower the amount of chlorine added, but “it’s really important not to use too little disinfectant”, Helte said.
Alternatives such as treating the water with ultraviolet light or installing new filtration systems are also possible, but are expensive, Helte said.
She stressed that people should continue to drink municipal water. Granulated activated carbon is among the best filtration systems that can be used at home to remove the contaminants.
Richie Nero, of Boyle & Fogarty Construction, shows the the cross section of an original lead, residential water service line, at left, and the replacement copper line, at right, outside a home where service was getting upgraded June 29, 2023, in Providence, R.I. (AP Photo/Charles Krupa, File)
WASHINGTON (AP) — The Trump administration said Friday it backs a 10-year deadline for most cities and towns to replace their harmful lead pipes, giving notice that it will support a tough rule approved under the Biden administration to reduce lead in drinking water.
The Environmental Protection Agency told a federal appeals court in Washington that it would defend the strongest overhaul of lead-in-water standards in three decades against a court challenge by a utility industry association.
The Trump administration has typically favored rapid deregulation, including reducing or killing rules on air and water pollution. On Friday, for example, it repealed tight limits on mercury and other toxic emissions from coal plants. But the agency has taken a different approach to drinking water.
“After intensive stakeholder involvement, EPA concluded that the only way to comply with the Safe Drinking Water Act’s mandate to prevent anticipated adverse health effects ‘to the extent feasible’ is to require replacement of lead service lines,” the agency’s court filing said.
Doing so by a 10-year deadline is feasible, the agency added, supporting a rule that was based in part of the finding that old rules that relied on chemical treatment and monitoring to reduce lead “failed to prevent system-wide lead contamination and widespread adverse health effects.”
The EPA said in August it planned to defend the Biden administration’s aggressive rule, but added that it would also “develop new tools and information to support practical implementation flexibilities and regulatory clarity.” Some environmental activists worried that that meant the EPA was looking to create loopholes.
Lead, a heavy metal once common in products like pipes and paints, is a neurotoxin that can stunt children’s development, lower IQ scores and increase blood pressure in adults. Lead pipes can corrode and contaminate drinking water. The previous Trump administration’s rule had looser standards and did not mandate the replacement of all pipes.
Standards aimed at protecting kids
The Biden administration finalized its lead-in-water overhaul in 2024. It mandated that utilities act to combat lead in water at lower concentrations, with just 10 parts per billion as a trigger, down from 15. If higher levels were found, water systems had to inform their consumers, take immediate action to reduce lead and work to replace lead pipes that are commonly the main source of lead in drinking water.
The Biden administration at the time estimated the stricter standards would protect up to 900,000 infants from having low birth weight and avoid up to 1,500 premature deaths a year from heart disease.
“People power and years of lead-contaminated communities fighting to clean up tap water have made it a third rail to oppose rules to protect our health from the scourge of toxic lead. Maybe only a hidebound water utility trade group is willing to attack this basic public health measure,” said Erik Olson, senior director at the Natural Resource Defense Council, an environmental nonprofit.
The American Water Works Association, a utility industry association, had challenged the rule in court, arguing the EPA lacks authority to regulate the portion of the pipe that’s on private property and therefore cannot require water systems to replace them.
The agency countered on Friday that utilities can be required to replace the entire lead pipe because they have sufficient control over them.
The AWWA also said the 10-year deadline wasn’t feasible, noting it’s hard to find enough labor to do the work and water utilities face other significant infrastructure challenges simultaneously. Water utilities were given three years to prepare before the 10-year timeframe starts and some cities with a lot of lead were given longer.
The agency said they looked closely at data from dozens of water utilities and concluded that the vast majority could replace their lead pipes in 10 years or less.
Replacing decades-old standards
The original lead and copper rule for drinking water was enacted by the EPA more than 30 years ago. The rules have significantly reduced lead in water but have been criticized for letting cities move too slowly when levels rose too high.
Lead pipes are most commonly found in older, industrial parts of the country, including major cities such as Chicago, Cleveland, Detroit and Milwaukee. The rule also revises the way lead amounts are measured, which could significantly expand the number of communities found violating the rules.
The EPA under President Donald Trump has celebrated deregulation. Officials have sought to slash climate change programs and promote fossil fuel development. On drinking water issues, however, their initial actions have been more nuanced.
In March, for example, the EPA announced plans to partially roll back rules to reduce so-called “forever chemicals” in drinking water — the other major Biden-era tap water protection. That change sought to keep tough limits for some common PFAS, but also proposed scrapping and reconsidering standards for other types and extending deadlines.
PFAS and lead pipes are both costly threats to safe water. There are some federal funds to help communities.
The Biden administration estimated about 9 million lead pipes provide water to homes and businesses in the United States. The Trump administration updated the analysis and now projects there are roughly 4 million lead pipes. Changes in methodology, including assuming that communities that did not submit data did not have lead pipes, resulted in the significant shift. The new estimate does correct odd results from some states — activists said that the agency’s initial assumptions for Florida, for example, seemed far too high.
The EPA declined to comment on pending litigation. The AWWA pointed to their previous court filing when asked for comment.
___
The Associated Press receives support from the Walton Family Foundation for coverage of water and environmental policy. The AP is solely responsible for all content. For all of AP’s environmental coverage, visit https://apnews.com/hub/climate-and-environment.
Source:Columbia University’s Mailman School of Public Health
Summary:A 20-year project in Bangladesh reveals that lowering arsenic levels in drinking water can slash death rates from major chronic diseases. Participants who switched to safer wells had the same risk levels as people who were never heavily exposed. The researchers tracked individual water exposure with detailed urine testing. Their results show how quickly health improves once contaminated water is replaced.Share:
FULL STORY
Cleaner water dramatically reduces chronic disease deaths, even for those exposed to arsenic for years. Credit: Shutterstock
A large 20-year investigation following nearly 11,000 adults in Bangladesh found that reducing arsenic in drinking water was tied to as much as a 50 percent drop in deaths from heart disease, cancer and several other chronic illnesses. The research offers the strongest long-term evidence so far that lowering arsenic exposure can reduce mortality, even for people who lived with contaminated water for many years. These results appear in JAMA.
Scientists from Columbia University, the Columbia Mailman School of Public Health and New York University led the analysis, which addresses a widespread health concern. Naturally occurring arsenic in groundwater remains a significant challenge across the world. In the United States, more than 100 million people depend on groundwater that can contain arsenic, particularly those using private wells. Arsenic continues to be one of the most common chemical contaminants in drinking water.
“We show what happens when people who are chronically exposed to arsenic are no longer exposed,” said co-lead author Lex van Geen of the Lamont-Doherty Earth Observatory, part of the Columbia Climate School. “You’re not just preventing deaths from future exposure, but also from past exposure.”
Two Decades of Data Strengthen the Evidence
Co-lead author Fen Wu of NYU Grossman School of Medicine said the findings offer the clearest proof yet of the connection between lowering arsenic exposure and reduced mortality risk. Over the course of two decades, the researchers closely tracked participants’ health and repeatedly measured arsenic through urine samples, which strengthened the precision of their analysis.
“Seeing that our work helped sharply reduce deaths from cancer and heart disease, I realized the impact reaches far beyond our study to millions in Bangladesh and beyond now drinking water low in arsenic,” said Joseph Graziano, Professor Emeritus at Columbia Mailman School of Public Health and principal investigator of the NIH-funded program. “A 1998 New York Times story first brought us to Bangladesh. More than two decades later, this finding is deeply rewarding. Public health is often the ultimate delayed gratification.”
Clear Drop in Risk When Arsenic Exposure Falls
People whose urinary arsenic levels fell from high to low had mortality rates that matched those who had consistently low exposure for the entire study. The size of the drop in arsenic was closely tied to how much mortality risk declined. Those who continued drinking high-arsenic water did not show any reduction in chronic disease deaths.
Arsenic naturally accumulates in groundwater and has no taste or smell, meaning people can drink contaminated water for years without knowing it. In Bangladesh, an estimated 50 million people have consumed water exceeding the World Health Organization’s guideline of 10 micrograms per liter. The WHO has described this as the largest mass poisoning in history.
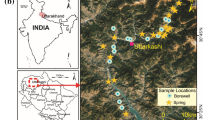
From 2000 to 2022, the Health Effects of Arsenic Longitudinal Study (HEALS) monitored thousands of adults in Araihazar, Bangladesh. The project tested more than 10,000 wells in a region where many families rely on shallow tube wells with arsenic levels ranging from extremely low to dangerously high.
Researchers periodically measured arsenic in participants’ urine, a direct marker of internal exposure, and recorded causes of death. These detailed data allowed the team to compare long-term health outcomes for people who reduced their exposure with those who remained highly exposed.
Community Efforts Created a Natural Comparison Group
Throughout the study period, national and local programs labeled wells as safe or unsafe based on arsenic levels. Many households switched to safer wells or installed new ones, while others continued using contaminated water. This created a natural contrast that helped researchers understand the effects of reducing exposure.
Arsenic exposure decreased substantially in Araihazar during the study. The concentration in commonly used wells fell by about 70 percent as many families sought cleaner water sources. Urine tests confirmed a corresponding decline in internal exposure, averaging a 50 percent reduction that persisted through 2022.
Reduced Exposure Brings Lasting Health Benefits
These trends held true even after researchers accounted for differences in age, smoking and socioeconomic factors. Participants who remained highly exposed, or whose exposure rose over time, continued to face significantly higher risks of death from chronic diseases.
The researchers compared the health benefits of lowering arsenic to quitting smoking. The risks do not disappear immediately but drop gradually as exposure decreases.
In Bangladesh, well testing, labeling unsafe sources, drilling private wells and installing deeper government wells have already improved water safety for many communities.
“Our findings can now help persuade policymakers in Bangladesh and other countries to take emergency action in arsenic ‘hot spots’,” said co-author Kazi Matin Ahmed of the University of Dhaka.
To reach more households, the research team is collaborating with the Bangladeshi government to make well data easier to access. They are piloting NOLKUP (“tubewell” in Bangla), a free mobile app created from more than six million well tests. Users can look up individual wells, review arsenic levels and depths, and locate nearby safer options. The tool also helps officials identify communities that need new or deeper wells.
Clean Water Investments Can Save Lives
The study shows that health risks can fall even for people who were exposed to arsenic for years. This highlights an important opportunity: investing in clean water solutions can save lives within a single generation.
“Sustainable funding to support the collection, storage and maintenance of precious samples and data over more than 20 years have made this critically important work possible,” said Ana Navas-Acien, MD, PhD, Professor and Chair of Environmental Health Sciences at Columbia Mailman School of Public Health. “Science is difficult and there were challenges and setbacks along the way, but we were able to maintain the integrity of the samples and the data even when funding was interrupted, which has allowed us to reveal that preventing arsenic exposure can prevent disease.”
The study team included researchers from Columbia University’s Mailman School of Public Health, the New York University Grossman School of Medicine, Lamont-Doherty Earth Observatory, Boston University School of Public Health, the Department of Geology at the University of Dhaka and the Institute for Population and Precision Health at the University of Chicago.
The HEALS project was launched by Columbia University through the National Institute of Environmental Health Sciences’ Superfund Research Program, with most U.S. collaborators based at Columbia when the study began.
Global sustainability challenges have recently led to an increasing interest in the management of water and health resources. Thus, the availability of effective, meaningful and open data is crucial to address those issues in the broader context of the Sustainable Development Goals of clean water and sanitation as targeted by the United Nations. In this paper, we present the Water Health Open Knowledge Graph (WHOW-KG) along with its design methodology and analysis on impact. Developed in the context of the EU-funded WHOW (Water Health Open Knowledge) project, the WHOW-KG is a semantic knowledge graph that models data on water consumption, pollution, extreme weather events, infectious disease rates and drug distribution. Indeed, it aims at supporting a wide range of applications: from knowledge discovery to decision-making, making it a valuable resource for researchers, policymakers, and practitioners in the water and health domains. The WHOW-KG consists of a network of five ontologies and related linked open data, modelled according to those ontologies. As a fully distributed system, it is sustainable over time, can handle large datasets, and allows data providers full control, establishing it as a vital European asset in the fields of water consumption and pollution.
Interest in water and sanitation management has grown in recent years driven by global sustainability challenges that prioritise, among the others, clean water and sanitation, as outlined in the UN Sustainable Development Goals1.
To provide effective responses to these global issues, the availability of high quality and open data becomes an essential requirement. However, the heterogeneity and complexity of water and health data, when available, can pose significant challenges. Not only data is heterogeneous both in format and in semantics, but mostly it does not guarantee, at any level, the FAIR principles2, designed to assess to what extent data is Findable, Accessible, Interoperable, and Reusable. FAIR principles aim at enhancing data sharing and reuse in both human and machine contexts. More specifically, findable refers to the fact that both data and metadata should be easy to locate for both humans and machines. This includes assigning persistent identifiers (e.g. DOIs) and ensuring metadata is richly described and indexed in searchable repositories. Accessible is about the use of standardised protocols to retrievable data and metadata. Instead, interoperable refers to the use of standardised formats, vocabularies, ontologies, and frameworks to ensure compatibility with other datasets, tools, and workflows, facilitating integration across disciplines. Finally, reusable refers to the specification of rich and detailed metadata to describe data, by including clear licensing terms, and adhere reproducible processes hence supporting reuse by third parties. However, some research studies3,4,5 show that (open) data are often not findable, and not accessible nor interoperable. This claim is especially relevant since the FAIR principles currently do not include detailed guidelines on data or software quality, nor do they address issues of trustworthiness or content interoperability—gaps that ontologies can help bridge6. Furthermore, the absence of clear licensing frameworks makes it common to encounter datasets with unspecified licenses, rendering direct reuse of the data impossible7. In response, only a few ontological modelling works have emerged to represent this fragmented knowledge within a FAIR framework, aiming to cater to the need for coverage of heterogeneous datasets in the international landscape.
This paper introduces the Water Health Open Knowledge Graph (WHOW-KG), which is the first European open distributed knowledge graph aimed at linking, using a common semantics, data on water consumption and quality with health parameters (e.g., infectious diseases rates, general health conditions of the population). Designed to understand the impact of water-related climate events, water quality, and water consumption on health, it provides a harmonised data layer that can be re-used for analysis, research, and development of innovative services and applications. The project’s primary driver was to establish a sustainable methodology for open knowledge graph production to ensure authoritativeness, timeliness, semantic accuracy, and consistency data quality characteristics, as well as metadata compliance with the European DCAT-AP profile8 and related national and thematic extensions.
The WHOW-KG currently consists of more than 100 millions of RDF triples from 19 selected datasets according to three use cases. The WHOW-KG is distributed and it is available via three SPARQL endpoints: two endpoints available from two data providers, i.e. Lombardy Region (https://lod.dati.lombardia.it/sparql) and ISPRA – Italian National Institute of Environmental Research (https://dati.isprambiente.it/sparql), and one endpoint from CNR – Institute of Cognitive Sciences and Technologies (https://semscout.istc.cnr.it/sparql). The Lombardy region was included in this project as one of the consortium partners (i.e. ARIA SpA) is the in-house company of the Lombardy region responsible for creating, managing, and curating open data on behalf of the region. Furthermore, Lombardy is recognised for its excellence in open data production. Those open data include extensive datasets covering microbiological, chemical, and physical parameters of water. Additional data from the Region’s Agency for Environmental Protection (ARPA) and its epidemiological observatory contribute to a comprehensive overview of the topics covered by WHOW, from bathing water quality to infectious diseases and associated health services. All the resources from the Lombardy Region are licensed under the Creative Commons Public Domain License (CC0) and the ones from ISPRA under the Creative Commons Attribution 4.0 International (CC-BY 4.0) License.
In summary, this paper presents the following contributions:
An analysis of the five WHOW ontologies: the Hydrography ontology, the Water Monitoring ontology, the Water Indicator Ontology, the Weather Monitoring ontology, and the Health Monitoring ontology; including a review of the state of the art in terms of similar works in both domains of water and health;
The WHOW-KG and a discussion of its impact;
A design methodology to support data providers in the publication of FAIR, highly extensible and sustainable Linked Open Data.
Scientists estimate that bottled water drinkers swallow up to 90,000 more microplastic particles per year than those who stick to tap water.
Source:Concordia University
Summary:A chance encounter with plastic waste on a tropical beach sparked a deep investigation into what those fragments mean for human health. The research reveals that bottled water isn’t as pure as it seems—each sip may contain invisible microplastics that can slip through the body’s defenses and lodge in vital organs. These tiny pollutants are linked to inflammation, hormonal disruption, and even neurological damage, yet remain dangerously understudied.Share:
FULL STORY
Recent research has revealed that people may be unknowingly ingesting tens of thousands of microplastic particles every year. On average, individuals consume between 39,000 and 52,000 particles annually, with bottled water drinkers taking in an additional 90,000 microplastic fragments compared to those who drink tap water. Credit: Shutterstock
Thailand’s Phi Phi Islands are known for their crystal-clear waters and white sand, not for launching advanced scientific research. Yet for one environmental scientist, the contrast between natural beauty and pollution sparked a major career shift from business to environmental science.
“I was standing there looking out at this gorgeous view of the Andaman Sea, and then I looked down and beneath my feet were all these pieces of plastic, most of them water bottles,” she says.
“I’ve always had a passion for waste reduction, but I realized that this was a problem with consumption.”
Armed with years of experience as co-founder of ERA Environmental Management Solutions, a company specializing in environmental, health and safety software, she returned to Concordia University to pursue a PhD on plastic waste. Her recent paper in the Journal of Hazardous Materials explores how single-use plastic water bottles pose potential health risks that remain largely overlooked in scientific research.
Hidden Hazards of Bottled Water
In an extensive review of more than 140 studies, the research reveals that people consume between 39,000 and 52,000 microplastic particles every year, and those who drink bottled water take in roughly 90,000 more than tap water users.
These microplastics are tiny fragments, often invisible to the eye. A typical particle measures between one micron (a thousandth of a millimeter) and five millimeters, while nanoplastics are even smaller. The contamination begins during manufacturing, transportation, and storage, when low-quality plastics release microscopic fragments — especially when exposed to sunlight and fluctuating temperatures. Unlike microplastics from food sources, those in bottled water are ingested directly.
Inside the Human Body
Once consumed, these particles can travel throughout the body. Studies indicate that microplastics can cross biological barriers, enter the bloodstream, and accumulate in organs. This may cause chronic inflammation, oxidative stress, hormonal disruption, reproductive impairment, neurological issues, and even some cancers. However, the long-term impact remains uncertain due to limited standardized testing and measurement techniques.
The researcher highlights that current detection tools vary in precision and capability. Some methods can spot smaller particles but cannot identify their composition, while others analyze chemical makeup but miss the tiniest plastics. The most advanced systems are both expensive and difficult to access, hindering consistent global study.
Rethinking Plastic Use Through Education
Despite growing environmental laws aimed at reducing plastic pollution, most regulations target items like shopping bags, straws, and packaging. Single-use water bottles often escape similar scrutiny.
“Education is the most important action we can take,” she says. “Drinking water from plastic bottles is fine in an emergency but it is not something that should be used in daily life. People need to understand that the issue is not acute toxicity — it is chronic toxicity.”
Chunjiang An, associate professor, and Zhi Chen, professor, in the Department of Building, Civil and Environmental Engineering at the Gina Cody School of Engineering and Computer Science contributed to this paper.
This research was supported by the Natural Sciences and Engineering Research Council of Canada and Concordia University.