Residents demand action over ‘Plymouth pongs’

BBC A man wearing a gilet and a cap stands near a sewage treatment works in Plympton and looks at the camera.
Michael Hanks is concerned about the health implications surrounding the smells in Plympton

by Britta Zeltmann and John Henderson

September 21, 2026

Residents living near two of a city’s sewage treatment works are calling for action over smells they say fill their homes and prevent them from using their gardens.

People in Plympton and Cattedown are among those who said the “eggy” sewage-like pongs, which residents said had been plaguing parts of Plymouth, Devon, for years.

Locals living near South West Water’s Marsh Mills wastewater treatment works claimed the smells had become worse since the development of a nearby new town, Sherford, which also uses the facility.

South West Water has set up an online tool for residents to report the odours and said it took the matter “seriously”.

It said it was carrying out work at its Marsh Mills site in Plympton to “rectify operational issues”, but stressed it had “sufficient capacity to treat flows from the Sherford development”.

A group of residents stand and talk to Cllr Terri Beer outside a South West Water waste water treatment works
Residents in Plympton want South West Water to address the persistent smells

The water company added it was in “regular contact with the Sherford Consortium regarding odour concerns”.

Residents, however, said more needed to be done.

Michael Hanks, 72, has lived near the Marsh Mills site since 2018. He said there were occasions when the smell was so bad his wife had “almost been physically sick”.

“We’re getting to the stage where we don’t want to invite people to our house because they smell it and it’s terrible,” he said.

“Are these treatment works capable of coping with everything? I don’t think they are.”

Cllr Terri Beer wears a floral suit and looks at the camera while standing outside a sign at the entrance of the treatment works. It reads: South West Water, Marsh Mills Wastewater Treatment Works
Councillor Terri Beer said residents were unable to keep their windows open or use their gardens

Paige Williams, 17, said: “It’s just disgusting. The other night I was woken up by the smell.

“Before, it used to be every now and again. Now it’s every single day. It’s really hard to ignore.”

Cathy Loft, 76, lives a mile (1.6km) from the Marsh Mills site and said the smell had “got enormously worse, particularly over the last three or four years”.

She said: “I don’t want to feel as though I’m living in sewer.

“Surely in this day and age they can make a sewerage farm that is big enough to take the sewage not only from Plympton, which is growing in size, but the nearby new town of Sherford, which has no sewerage facility.

“How can it possibly deal with all that excrement?”

Sherford has a pumping station to collect wastewater which is then pumped under pressure to the Marsh Mills site.

The Sherford Consortium said it commissioned independent specialists to carry out testing after odour mitigation works in July and stressed the work had been “entirely successful”.

It added the results “factually demonstrate that Sherford is not contributing to the ongoing odour issues affecting the Plympton area”.

Independent city councillor for Plympton Erle Terri Beer said: “People are really suffering.

“House prices will start to plummet in time and people are worried, they’re selling up and moving away.”

She added: “If you sleep with your bedroom window open, the smell permeates into your bedroom, gets into your soft furnishings, your curtains, your bedding.

“People can’t enjoy their gardens, they can’t hang the washing out, they can’t let their children play.

“We don’t know what damage this is doing to our health here in Plympton.”

She added Rebecca Smith, the Conservative MP for South West Devon, was aware of the situation.

‘Very rotten’

In Cattedown, closer to Plymouth city centre, residents living near the wastewater treatment works on Finnigan Road said they were facing similar issues.

Colleagues Stella Scallon and Poppy Beer said the area regularly smelt like “sewage” or “dead fish”, often smelling the odour on their way home from work.

Samuel Lakey, 27, said the whiff was “unbearable” and “something should really be done about it”.

“It’s very eggy, very rotten,” he said.

“Me and my dad walk down here every evening – it stinks.”

a woman wearing a fluffy black jacket stands on the pavement and looks directly at the camera.
Mother-of-three Jennifer Japhet said the smell in Cattedown was at its worst in the morning

Mother-of-three Jennifer Japhet, who has lived in Cattedown for the last year, added: “It’s awful. It’s usually every day in the morning. This is the first time I’m experiencing something like this.”

Plymouth City Council has launched a separate survey asking residents and businesses across Plymouth to share their experiences of the persistent odours, helping them to “better understand the location, frequency and impact”.

Once the survey closed, the findings would be presented to the council’s Natural Infrastructure and Growth Scrutiny Panel, with South West Water invited to attend a scrutiny meeting on the subject, the council said.

Luke Pollard, the Labour MP for Plymouth Sutton and Devonport, said: “The more reports that are submitted, the stronger the evidence and the greater the pressure on South West Water to deliver a lasting solution.”

Two women stand together by the road and smile at the camera.
Stella Scallon and Poppy Beer said the smell was like sewage

A spokesperson for South West Water said it took complaints about odour seriously and its “customers and the environment are important to us”.

They said work to rectify “operational issues” at Marsh Mills were focused on “protecting the environment, reducing odours, and preventing similar issues occurring in the future”.

This involved removing sludge from the site for treatment elsewhere, the company said.

It added: “Our site at Marsh Mills has sufficient capacity to treat flows from the Sherford development.

“We remain in regular contact with the Sherford Consortium regarding odour concerns and continue to review progress and effectiveness of measures being implemented by them on their site.

“We are also aware of reports from other parts of Plymouth, including around Cattedown. As smells can originate from a range of sources, we have contacted nearby residents with details of how they can report odours to help us investigate what residents are experiencing across the area.

“We encourage anyone experiencing persistent odour issues to use our online reporting tool, as this helps us identify patterns and target our investigations.

“We understand the frustration this is causing and remain committed to understanding the causes and taking action where required.”

Sherford Consortium said it “appointed specialists to run tests in July and August,” placing gas monitoring equipment, taking samples, and carrying out analysis at “both Sherford’s pumping station and at the chamber by Merafield Road”.

It added: “The report confirms that the changes made to the foul water pump station are performing as intended. Septicity is being successfully controlled through chemical dosing, and the treatment being applied is effective without being excessive.”

It went on to note its pumping station was being monitored “around the clock by a specialist maintenance contractor” and the consortium would “continue to monitor septicity levels, altering the dosing volumes if required, and maintain the facilities until South West Water takes over responsibility for the pumping station”.

Follow BBC Devon on X, Facebook and Instagram. Send your story ideas to spotlight@bbc.co.uk.

EPA stalls long-planned nitrate cancer review as pollution crisis grows

by Brian Bienkowski, The New Lede
August 4, 2026

The US Environmental Protection Agency (EPA) has backed off its re-assessment of cancer-causing nitrates despite decades of research suggesting the contaminant is more harmful than previously thought and that nitrate pollution is at crisis levels in US drinking water. 

The agency would not confirm the assessment was cancelled, but the work has been stagnant for more than two years and the department responsible for it was eliminated. And scientists and health advocates say regardless of whether it has been cancelled or is locked in a lengthy delay — Americans are paying the price with their health. 

The EPA set a threshold for nitrates in drinking water more than 30 years ago at a level designed to avoid harming babies after research showed that ingesting nitrates could trigger dangerously low oxygen in babies’ blood, what’s known as “blue baby syndrome.” The EPA announced it would re-assess nitrates — and nitrites — in 2017 to look at other potential health impacts, including cancer,  but the work was suspended in 2019 by the first Trump administration. 

The Biden administration re-started the work, and the EPA accepted public comments on the planned assessment in 2023 but the agency hasn’t provided an update since. Earlier this year, the Trump administration eliminated the EPA’s Office of Research and Development, which housed the Integrated Risk Information System (IRIS) and was responsible for such health assessments.

“The assessment was intended to do the hard science to support appropriate human health protections,” said Tyler Lobdell, a senior staff attorney with Food & Water Watch. “It’s alarming that the Trump administration has decided to undermine that process.”

“It’s alarming that the Trump administration has decided to undermine that process.” -Tyler Lobdell, Food & Water Watch

Independent research has significantly advanced since the EPA set its drinking water threshold in 1991. Nitrates can be naturally occurring, but nitrate pollution in waterways has been tied to heavy use of nitrogen-based fertilizers and the spreading of large amounts of livestock manure on farm fields as fertilizer. Nitrate contamination has been linked to cancer and other health problems, particularly in prominent farm states.

The current EPA nitrate threshold for nitrates under the Safe Drinking Water Act is 10 parts per million (ppm) — a level that researchers and health advocates say is far too high to protect health. Studies have linked nitrate exposure below 10 ppm to increased risk of colorectal cancer, bladder cancer, thyroid disease and other health problems. 

“We need IRIS to go and do another health assessment on nitrates because links to cancer and birth defects keep popping up in the scientific literature,” said David Cwiertny, a researcher and director of the University of Iowa’s Center for Health Effects of Environmental Contamination.

IRIS assessments don’t create legal standards but inform the EPA when it sets drinking water limits. 

The EPA’s delayed assessment is particularly troubling because the agency itself has acknowledged increasing evidence that nitrates contribute to cancers and birth defects, Cwiertny said. The EPA cited new science on cancer and birth defects in the 2010 drinking water standards review as well as in its 2017 scoping review. 

“That’s the EPA saying ‘this is science worth paying attention to,’” Cwiertny said. “They’ve opened the door acknowledging the need for more assessment and then just left it ajar.” 

Brigit Hirsch, press secretary for the EPA, did not comment on the status of the assessment, but said that research on nitrate in drinking water was “largely transitioned to the Office of Water … as part of the agency’s strategic reorganization to better align scientific research with policy development and program implementation.” 

Hirsch also pointed to the agency’s six-year review of nitrate completed in 2024 that concluded the current health threshold did not need to be revised. 

Nitrates pervasive in US drinking water 

The stalled assessment comes as nitrate pollution becomes more pervasive: an April report from the Environmental Working Group (EWG) found more than 60 million Americans get their water from sources contaminated with elevated levels of nitrate pollution. The report found that the majority of the pollution is likely coming from agricultural manure or fertilizer runoff. 

“They’ve opened the door acknowledging the need for more assessment and then just left it ajar.” -David Cwiertny, University of Iowa

The water systems with the highest and most frequent nitrate levels were in heavy agricultural states. And federal research is key to bolstering drinking water protections in those states, said Nancy Stoner, a senior attorney at the Environmental Law & Policy Center. 

“States rely upon the EPA to be able to do deep science. Whether it’s drinking water standards or water quality standards, most of that is done at the federal level,” Stoner said.  

The nitrate problem is particularly bad in Iowa, which is the nation’s top corn and hog producer and has loads of nitrates washing into waterways from manure and fertilizer. Iowa also has the second-highest rate of cancer in the nation and is only one of three states where cancer is rising, according to the National Institutes of Health. For many types of cancer, the state’s numbers dwarf national averages — and nitrates are a key culprit. 

“In science, we’re unfortunately not going to get something very definitive that this contaminant is causing this,” Cwiertny said. “The point is that there are now enough converging lines of evidence out there.” 

The Des Moines water utility has frequently asked residents to cut back on water use over the past few years because nitrate levels are so high in drinking water supplies that the utility is having a hard time treating the nitrates in the water. The Des Moines and Raccoon rivers in Iowa are in the top 1% of rivers nationwide for nitrate concentration, with an estimated 80% of the contamination coming from agriculture.

“Even for places like this where the current nitrate drinking water standard applies … we’ve seen such high levels of nitrate in source water that municipal water utilities are struggling to remove it,” said Stacy Woods, a research director for the Food & Environment program at the Union of Concerned Scientists. 

Woods added that nitrates’ health impacts extend beyond farming states. 

“Nitrate pollution can travel hundreds of miles through streams and rivers and groundwater and other connected water bodies,” she said. “That water-to-water pathway is how fertilizer in the Midwest creates pollution all the way down in the Gulf of Mexico.” 

Pressing the EPA for information  

In May, Stoner and Woods co-authored a letter, which was signed by more than 80 health and environmental groups, sent to Health and Human Services (HHS) Secretary Robert F. Kennedy Jr. and EPA administrator Lee Zeldin urging the officials to protect Americans from a “public health emergency” driven by nitrate pollution.

“It is imperative that EPA and HHS act now to address this public health emergency in Iowa and across the country,” the letter states. “Your agencies should immediately identify and eliminate sources of nitrate pollution in drinking water and provide funds to communities to reduce nitrate to safe levels.”

Stoner said she and others met with some officials at the EPA about the letter, but haven’t received an official response from the agency, nor have they heard from HHS. 

Food & Water Watch sued the EPA in June alleging the agency has failed to release records under Freedom of Information Act (FOIA) requests about the stalled nitrate assessment. Food & Water Watch requested such records in August 2025 after the EPA had cut staffing and announced plans to eliminate the Office of Research and Development.  

Lobdell said he worked with EPA staffers for several months to get the records and they told him “scientists were being reassigned.” 

“That’s pretty vague but it’s clear that the teams, the department, and the organizational structure that supported this kind of work is gone,” he said. 

Featured image: Administrator of the Environmental Protection Agency Lee Zeldin. (Credit: Gage Skidmore/flickr) 

FOR MORE INFORMATION GO TO: https://www.thenewlede.org/2026/08/epa-nitrates-cancer-drinking-water/

Integrating water quality and water quantity to diagnose the health of water metabolism systems in multi-core multi-level urban agglomerations

Author links open overlay panelYing Yang a1

, Jing Wen a1

, Meirong Su b

, Qionghong Chen cShow moreAdd to MendeleyShareCite

https://doi.org/10.1016/j.watres.2025.123899Get rights and content

Highlights

  • •The MRIO table was compiled for a multi-core multi-level urban agglomeration.
  • •A diagnostic framework was established by coupling ENA and MRIO approaches.
  • •Water quantity-water quality linkage was considered in the diagnostic framework.
  • •The IWMN was less vigorous and less organized than the QWMN.
  • •The IWMN tended slightly towards mutualism but had more negative collaborations.

Abstract

Urban agglomerations (UAs) are compelled to scrutinize the health of their water systems as the frequency of water crises increases. An urban water system’s health is closely related to metabolism processes. To date, water systems in multi-core multi-level UAs have not been analyzed using water quantity and water quality because of methodological constraints. To address this research gap, we developed an integrated water quality–water quantity model for diagnosing water metabolism systems that could process nested multi-region input-output (MRIO) tables. We coupled the MRIO tables and established two networks, an integrated water quantity–quality metabolism network (IWMN) and a water quantity metabolism network (QWMN). We tested the two networks with data from the Guangdong-Hong Kong-Macao UA and assessed four aspects of the networks’ health, namely vigor, organization, resilience, and collaboration, using ecological network analysis. We discovered that IWMN exhibited lower vigor (internal circulation 10.4 %) and organization dominated by dependency (total contribution intensity σ = -23) compared to the QWMN. Polity-driven disparities shaped the robustness distribution, while a mutualism tendency coexisted with a complex exploitation relationship (52.4 %), particularly in the core large-sized city of Hong Kong, where 58 new competitive pairs emerged. Thus, we recommend prioritizing Guangdong-Hong Kong-Macao trade optimization for high-water-content products to enhance system health.

Graphical abstract

Image, graphical abstract

Introduction

The surface water deficit experienced in 482 of the world’s largest cities is projected to reach 6.75 million tons by 2050 because of an imbalance between the water supply and the demand (Flörke et al., 2018). This trend has prompted growing interest in resource allocation and environmental protection within urban agglomerations (UAs). UAs are composed of multiple geographically adjacent cities with diverse sizes and characteristics (Fang et al., 2015). Diverse UAs with multi-core structures (classified by comprehensive urban engine functions) and multi-level systems (quantified by social indicators) face challenges due to high heterogeneity in population size and spatial resource allocation (Han et al., 2019; Chirigati, 2022; Zhao et al., 2021). Water quantity and water quality are important attributes of water resources. Changes in the water quantity caused by a lack of rainfall or heavy rainfall events affect the water quality by concentrating pollutants or diluting. Conversely, degraded water quality diminishes the availability of water resources (Li et al., 2023) and has direct effects on urban aquatic ecosystems (Liu and Yang, 2012). Therefore, to optimize water management in multi-core multi-level UAs, we need to know more about the combined effects of water quality and water quantity on the water resources.

When optimizing water management in urban areas, the water metabolism mechanism of the system should be analyzed, and key issues should be identified (Cao et al., 2021; He et al., 2020b; Liu et al., 2022). The concept of water metabolism originates from urban metabolism (Wolman, 1965), which describes water cycle processes (e.g., water input, output, and storage) driven by social activities in different cities (Wang and Chen, 2010). This concept can effectively identify hidden risks resulting from the allocation of social resources—such as population, industry and environment within UAs, thus challenging the traditional multilevel paradigm of urban water management. In assessing the health of water systems based on water metabolism mechanisms, processes analogous to those in natural ecosystems, such as vigor and collaboration (Y.J. Yang et al., 2020; Zhu et al., 2020), sustained and stable organization, and adaptability to external pressures (Yan et al., 2014), are employed. However, to date, most research has primarily focused on the efficiency of consumptive activities (Nishimura et al., 2021; Qi et al., 2021; Xu et al., 2020), while ignoring the underlying water metabolism processes.

Network methods are effective for characterizing critical resource metabolism processes (Liang et al., 2020). Ecological Network Analysis (ENA) (Hannon B, 1973) quantifies metabolic features via resource fluxes (Fath, 2004; Ulanowicz et al., 2009), offering insights into system health. For example, resource footprint circulation rates reflect node vigor; balanced control-dependency relationships enhance organizational capacity; maintaining metabolic orderliness optimizes resilience thresholds; and niche complementarity indices help analyze co-evolutionary collaboration. There is concern about the approaches used to quantitatively assess the resource flows within a network. A bottom-up approach uses industrial processes to track water flows (Vanham and Bidoglio, 2013), but a top-down approach quantitatively assesses the resource flows within a network (Feng et al., 2011). For example, input-output analysis (IOA), an accepted method for quantifying water flows in a water metabolism system, is preferred over bottom-up approaches because it can link industrial economic data to water consumption using input-output tables and produce a high-resolution view of the networked water flow transactions, helping us to address issues caused within UAs by economic trade, such as water-related resource flows, ecosystem services, and health status (Hubacek and Feng, 2016). However, our ability to carry out a comprehensive and accurate assessment of water system health within UAs is hampered by a lack of high-resolution MRIO data for multi-core multi-level UAs, which has resulted from the poor alignment of statistical standards used for trade data across cities of different levels.

To date, there is little clarity about how the combination of water quantity and water quality influences the health of water metabolism systems in UAs. Cao et al. (2021) were the first to evaluate the health of water networks using an assessment model that focused on water quantity, but excluded water quality. Adequate water quantity and sufficient water quality are essential for the sustainable use of urban water resources (Cai et al., 2023). A water footprint, which incorporates both water quantity and water quality, can be used to assess water flows (Hoekstra and Mekonnen, 2012). Various water footprints have been defined, and the blue water footprint (BWF) and grey water footprint (GWF) have been used to quantify both water quantity and water quality (Chapagain and Hoekstra, 2011; Yu et al., 2022). In previous studies, researchers have focused on either water quantity or water quality when assessing the intensity of resource transfers (Cai et al., 2023; Zhao et al., 2016) and the factors that influenced them (Cai and Guo, 2023; Guan et al., 2014). Some researchers have also simulated and evaluated the performance of metabolism systems using either water quantity or water quality as the independent metabolism medium (He et al., 2020b, 2020a; Liu et al., 2022). The conventional separation of water quantity and quality in current research paradigms makes it difficult to reveal the cascading effects of their synergistic interactions on multiscale metabolism systems, which may lead to ecological cognitive bias in system health assessments. As synergistic variables within regional metabolism system, the mechanisms underlying the interactions between water quantity and water quality remain underexplored. It is imperative to conceptualize water quantity and quality as an integrated metabolism medium and develop a corresponding theoretical framework to elucidate how their synergistic metabolic processes influence system health.

The diagnoses of water metabolism system health at the UA scale are constrained by a) a lack of MRIO tables, which hinders the accurate assessment of water flow within UAs with multi-core and multi-level cities, and b) a limited understanding of how the health of metabolism systems is influenced when water quantity and water quality are combined into a single metabolism medium. To address these issues, we proposed a method for compiling MRIO tables for multi-core multi-level UAs that resolved the methodological limitations associated with assessments of water flow. We created two networks based on MRIO and ENA, one that integrated water quantity and water quality and another for water quantity only, and assessed four attributes of the health of the two networks, namely vigor, organization, resilience, and collaboration. We then tested the method with data from the Guangdong-Hong Kong-Macao Greater Bay Area UA (GBA).

CLICK HERE FOR MORE INFORMATION

https://www.sciencedirect.com/science/article/abs/pii/S0043135425008073?via%3Dihub

Active pharmaceutical contaminants in drinking water: myth or fact?

You have full access to thisopen accessarticle

Download PDF

Save article

DARU Journal of Pharmaceutical SciencesAims and scopeSubmit manuscript

Active pharmaceutical contaminants in drinking water: myth or fact?

Download PDF

Abstract

Global water availability has been affected by a variety of factors, including climate change, water pollution, urbanization, and population growth. These issues have been particularly acute in many parts of the world, where access to clean water remains a significant challenge. In this context, preserving existing water bodies is a critical priority. Numerous studies have demonstrated the inadequacy of conventional water treatment processes in removing active pharmaceutical ingredients (APIs) from the water. These pharmaceutical active compounds have been detected in treated wastewater, groundwater, and even drinking water sources. The presence of APIs in water resources poses a significant threat not only to aquatic organisms but also to human health. These emerging contaminants have the potential to disrupt endocrine systems, promote the development of antibiotic-resistant bacteria, and bioaccumulate in the food chain, ultimately leading to unacceptable risks to public health. The inability of current conventional treatment methods to effectively remove APIs from water has raised serious concerns about the safety and reliability of water supplies. This issue requires immediate attention and the development of more effective treatment technologies to safeguard the quality of water resources and protect both aquatic ecosystems and human health. Other treatment methods, such as nanotechnology, microalgal treatment, and reverse osmosis, are promising in addressing the issue of API contamination in water resources. These innovative approaches have demonstrated higher removal efficiencies for a wide range of APIs compared to conventional methods, such as activated sludge and chlorination, which have been found to be inadequate in the removal of these emerging contaminants. The potential of these alternative treatment technologies to serve as effective tertiary treatment. To address this critical challenge, governments and policymakers should prioritize investment in research and development to establish effective and scalable solutions for eliminating APIs from various water sources. This should include comprehensive studies to assess the performance, cost-effectiveness, and environmental sustainability of emerging treatment technologies. The emerging contaminants should be included in robust water quality monitoring programs (Aus der Beek et al. in Environ Toxicol Chem 2016;35(4):823-835), with strict regulatory limits enforced to protect public health and the environment. By doing so, the scientific community and regulatory authorities can work together to develop a multi-barrier approach to safeguarding the water resources and ensuring access to safe, clean water for all. This review explores the potential of alternative treatment technologies to serve as viable solutions in the fight against API contamination. Innovative approaches, including nanotechnology, microalgal treatment, and reverse osmosis, have demonstrated remarkable success in addressing this challenge, exhibiting higher removal efficiencies compared to traditional methods.

CLICK HERE FOR MORE INFORMATION

https://link.springer.com/article/10.1007/s40199-024-00536-9

Trump administration to stand by tough Biden-era mandates to replace lead pipes

MAY CONTAIN POLITICAL INFLUENCES!

Richie Nero, of Boyle & Fogarty Construction, shows the the cross section of an original lead, residential water service line, at left, and the replacement copper line, at right, outside a home where service was getting upgraded June 29, 2023, in Providence, R.I. (AP Photo/Charles Krupa, File)

By  MICHAEL PHILLIS Updated 9:13 PM EST, February 20, 2026

WASHINGTON (AP) — The Trump administration said Friday it backs a 10-year deadline for most cities and towns to replace their harmful lead pipes, giving notice that it will support a tough rule approved under the Biden administration to reduce lead in drinking water.

The Environmental Protection Agency told a federal appeals court in Washington that it would defend the strongest overhaul of lead-in-water standards in three decades against a court challenge by a utility industry association.

The Trump administration has typically favored rapid deregulation, including reducing or killing rules on air and water pollution. On Friday, for example, it repealed tight limits on mercury and other toxic emissions from coal plants. But the agency has taken a different approach to drinking water.

“After intensive stakeholder involvement, EPA concluded that the only way to comply with the Safe Drinking Water Act’s mandate to prevent anticipated adverse health effects ‘to the extent feasible’ is to require replacement of lead service lines,” the agency’s court filing said.

Doing so by a 10-year deadline is feasible, the agency added, supporting a rule that was based in part of the finding that old rules that relied on chemical treatment and monitoring to reduce lead “failed to prevent system-wide lead contamination and widespread adverse health effects.”

The EPA said in August it planned to defend the Biden administration’s aggressive rule, but added that it would also “develop new tools and information to support practical implementation flexibilities and regulatory clarity.” Some environmental activists worried that that meant the EPA was looking to create loopholes.

Lead, a heavy metal once common in products like pipes and paints, is a neurotoxin that can stunt children’s development, lower IQ scores and increase blood pressure in adults. Lead pipes can corrode and contaminate drinking water. The previous Trump administration’s rule had looser standards and did not mandate the replacement of all pipes.

Standards aimed at protecting kids

The Biden administration finalized its lead-in-water overhaul in 2024. It mandated that utilities act to combat lead in water at lower concentrations, with just 10 parts per billion as a trigger, down from 15. If higher levels were found, water systems had to inform their consumers, take immediate action to reduce lead and work to replace lead pipes that are commonly the main source of lead in drinking water.

The Biden administration at the time estimated the stricter standards would protect up to 900,000 infants from having low birth weight and avoid up to 1,500 premature deaths a year from heart disease.

“People power and years of lead-contaminated communities fighting to clean up tap water have made it a third rail to oppose rules to protect our health from the scourge of toxic lead. Maybe only a hidebound water utility trade group is willing to attack this basic public health measure,” said Erik Olson, senior director at the Natural Resource Defense Council, an environmental nonprofit.

The American Water Works Association, a utility industry association, had challenged the rule in court, arguing the EPA lacks authority to regulate the portion of the pipe that’s on private property and therefore cannot require water systems to replace them.

The agency countered on Friday that utilities can be required to replace the entire lead pipe because they have sufficient control over them.

The AWWA also said the 10-year deadline wasn’t feasible, noting it’s hard to find enough labor to do the work and water utilities face other significant infrastructure challenges simultaneously. Water utilities were given three years to prepare before the 10-year timeframe starts and some cities with a lot of lead were given longer.

The agency said they looked closely at data from dozens of water utilities and concluded that the vast majority could replace their lead pipes in 10 years or less.

Replacing decades-old standards

The original lead and copper rule for drinking water was enacted by the EPA more than 30 years ago. The rules have significantly reduced lead in water but have been criticized for letting cities move too slowly when levels rose too high.

Lead pipes are most commonly found in older, industrial parts of the country, including major cities such as Chicago, Cleveland, Detroit and Milwaukee. The rule also revises the way lead amounts are measured, which could significantly expand the number of communities found violating the rules.

The EPA under President Donald Trump has celebrated deregulation. Officials have sought to slash climate change programs and promote fossil fuel development. On drinking water issues, however, their initial actions have been more nuanced.

In March, for example, the EPA announced plans to partially roll back rules to reduce so-called “forever chemicals” in drinking water — the other major Biden-era tap water protection. That change sought to keep tough limits for some common PFAS, but also proposed scrapping and reconsidering standards for other types and extending deadlines.

PFAS and lead pipes are both costly threats to safe water. There are some federal funds to help communities.

The Biden administration estimated about 9 million lead pipes provide water to homes and businesses in the United States. The Trump administration updated the analysis and now projects there are roughly 4 million lead pipes. Changes in methodology, including assuming that communities that did not submit data did not have lead pipes, resulted in the significant shift. The new estimate does correct odd results from some states — activists said that the agency’s initial assumptions for Florida, for example, seemed far too high.

The EPA declined to comment on pending litigation. The AWWA pointed to their previous court filing when asked for comment.

___

The Associated Press receives support from the Walton Family Foundation for coverage of water and environmental policy. The AP is solely responsible for all content. For all of AP’s environmental coverage, visit https://apnews.com/hub/climate-and-environment.

CLICK HERE FOR MORE INFORMATION

https://apnews.com/article/trump-lead-pipes-drinking-water-contamination-epa-6e1c7c45f1ba41ae69dfb13fa9510ef8

Integrating water quality and water quantity to diagnose the health of water metabolism systems in multi-core multi-level urban agglomerations

Author links open overlay panelYing Yang a1

, Jing Wen a1

, Meirong Su b

, Qionghong Chen cShow moreAdd to MendeleyShareCite

https://doi.org/10.1016/j.watres.2025.123899Get rights and content

Highlights

  • •The MRIO table was compiled for a multi-core multi-level urban agglomeration.
  • •A diagnostic framework was established by coupling ENA and MRIO approaches.
  • •Water quantity-water quality linkage was considered in the diagnostic framework.
  • •The IWMN was less vigorous and less organized than the QWMN.
  • •The IWMN tended slightly towards mutualism but had more negative collaborations.

Abstract

Urban agglomerations (UAs) are compelled to scrutinize the health of their water systems as the frequency of water crises increases. An urban water system’s health is closely related to metabolism processes. To date, water systems in multi-core multi-level UAs have not been analyzed using water quantity and water quality because of methodological constraints. To address this research gap, we developed an integrated water quality–water quantity model for diagnosing water metabolism systems that could process nested multi-region input-output (MRIO) tables. We coupled the MRIO tables and established two networks, an integrated water quantity–quality metabolism network (IWMN) and a water quantity metabolism network (QWMN). We tested the two networks with data from the Guangdong-Hong Kong-Macao UA and assessed four aspects of the networks’ health, namely vigor, organization, resilience, and collaboration, using ecological network analysis. We discovered that IWMN exhibited lower vigor (internal circulation 10.4 %) and organization dominated by dependency (total contribution intensity σ = -23) compared to the QWMN. Polity-driven disparities shaped the robustness distribution, while a mutualism tendency coexisted with a complex exploitation relationship (52.4 %), particularly in the core large-sized city of Hong Kong, where 58 new competitive pairs emerged. Thus, we recommend prioritizing Guangdong-Hong Kong-Macao trade optimization for high-water-content products to enhance system health.

Graphical abstract

Image, graphical abstract

Introduction

The surface water deficit experienced in 482 of the world’s largest cities is projected to reach 6.75 million tons by 2050 because of an imbalance between the water supply and the demand (Flörke et al., 2018). This trend has prompted growing interest in resource allocation and environmental protection within urban agglomerations (UAs). UAs are composed of multiple geographically adjacent cities with diverse sizes and characteristics (Fang et al., 2015). Diverse UAs with multi-core structures (classified by comprehensive urban engine functions) and multi-level systems (quantified by social indicators) face challenges due to high heterogeneity in population size and spatial resource allocation (Han et al., 2019; Chirigati, 2022; Zhao et al., 2021). Water quantity and water quality are important attributes of water resources. Changes in the water quantity caused by a lack of rainfall or heavy rainfall events affect the water quality by concentrating pollutants or diluting. Conversely, degraded water quality diminishes the availability of water resources (Li et al., 2023) and has direct effects on urban aquatic ecosystems (Liu and Yang, 2012). Therefore, to optimize water management in multi-core multi-level UAs, we need to know more about the combined effects of water quality and water quantity on the water resources.

When optimizing water management in urban areas, the water metabolism mechanism of the system should be analyzed, and key issues should be identified (Cao et al., 2021; He et al., 2020b; Liu et al., 2022). The concept of water metabolism originates from urban metabolism (Wolman, 1965), which describes water cycle processes (e.g., water input, output, and storage) driven by social activities in different cities (Wang and Chen, 2010). This concept can effectively identify hidden risks resulting from the allocation of social resources—such as population, industry and environment within UAs, thus challenging the traditional multilevel paradigm of urban water management. In assessing the health of water systems based on water metabolism mechanisms, processes analogous to those in natural ecosystems, such as vigor and collaboration (Y.J. Yang et al., 2020; Zhu et al., 2020), sustained and stable organization, and adaptability to external pressures (Yan et al., 2014), are employed. However, to date, most research has primarily focused on the efficiency of consumptive activities (Nishimura et al., 2021; Qi et al., 2021; Xu et al., 2020), while ignoring the underlying water metabolism processes.

Network methods are effective for characterizing critical resource metabolism processes (Liang et al., 2020). Ecological Network Analysis (ENA) (Hannon B, 1973) quantifies metabolic features via resource fluxes (Fath, 2004; Ulanowicz et al., 2009), offering insights into system health. For example, resource footprint circulation rates reflect node vigor; balanced control-dependency relationships enhance organizational capacity; maintaining metabolic orderliness optimizes resilience thresholds; and niche complementarity indices help analyze co-evolutionary collaboration. There is concern about the approaches used to quantitatively assess the resource flows within a network. A bottom-up approach uses industrial processes to track water flows (Vanham and Bidoglio, 2013), but a top-down approach quantitatively assesses the resource flows within a network (Feng et al., 2011). For example, input-output analysis (IOA), an accepted method for quantifying water flows in a water metabolism system, is preferred over bottom-up approaches because it can link industrial economic data to water consumption using input-output tables and produce a high-resolution view of the networked water flow transactions, helping us to address issues caused within UAs by economic trade, such as water-related resource flows, ecosystem services, and health status (Hubacek and Feng, 2016). However, our ability to carry out a comprehensive and accurate assessment of water system health within UAs is hampered by a lack of high-resolution MRIO data for multi-core multi-level UAs, which has resulted from the poor alignment of statistical standards used for trade data across cities of different levels.

To date, there is little clarity about how the combination of water quantity and water quality influences the health of water metabolism systems in UAs. Cao et al. (2021) were the first to evaluate the health of water networks using an assessment model that focused on water quantity, but excluded water quality. Adequate water quantity and sufficient water quality are essential for the sustainable use of urban water resources (Cai et al., 2023). A water footprint, which incorporates both water quantity and water quality, can be used to assess water flows (Hoekstra and Mekonnen, 2012). Various water footprints have been defined, and the blue water footprint (BWF) and grey water footprint (GWF) have been used to quantify both water quantity and water quality (Chapagain and Hoekstra, 2011; Yu et al., 2022). In previous studies, researchers have focused on either water quantity or water quality when assessing the intensity of resource transfers (Cai et al., 2023; Zhao et al., 2016) and the factors that influenced them (Cai and Guo, 2023; Guan et al., 2014). Some researchers have also simulated and evaluated the performance of metabolism systems using either water quantity or water quality as the independent metabolism medium (He et al., 2020b, 2020a; Liu et al., 2022). The conventional separation of water quantity and quality in current research paradigms makes it difficult to reveal the cascading effects of their synergistic interactions on multiscale metabolism systems, which may lead to ecological cognitive bias in system health assessments. As synergistic variables within regional metabolism system, the mechanisms underlying the interactions between water quantity and water quality remain underexplored. It is imperative to conceptualize water quantity and quality as an integrated metabolism medium and develop a corresponding theoretical framework to elucidate how their synergistic metabolic processes influence system health.

The diagnoses of water metabolism system health at the UA scale are constrained by a) a lack of MRIO tables, which hinders the accurate assessment of water flow within UAs with multi-core and multi-level cities, and b) a limited understanding of how the health of metabolism systems is influenced when water quantity and water quality are combined into a single metabolism medium. To address these issues, we proposed a method for compiling MRIO tables for multi-core multi-level UAs that resolved the methodological limitations associated with assessments of water flow. We created two networks based on MRIO and ENA, one that integrated water quantity and water quality and another for water quantity only, and assessed four attributes of the health of the two networks, namely vigor, organization, resilience, and collaboration. We then tested the method with data from the Guangdong-Hong Kong-Macao Greater Bay Area UA (GBA).

CLICK HERE FOR MORE INFORMATION

https://www.sciencedirect.com/science/article/abs/pii/S0043135425008073?via%3Dihub
Influence of particulate matter air quality on water quality of atmospheric water harvesting

Author links open overlay panelMatthew Russell ab

, Alex Webster c

, Carl Abadam bd

, Katelin Fisher b

, Stephanie Campbell bd

, Carmen Atchley bd

, Kana Radius bd

, Paris Eisenman bd

, Ashley Apodaca-Sparks bd

, Astrid Gonzaga bd

, Rui Liu e

, Patrick Hudson f

, Anjali Mulchandani abdShow moreAdd to MendeleyShareCite

https://doi.org/10.1016/j.watres.2025.124213Get rights and content

Under a Creative Commons license

Open access

Abstract

Atmospheric water harvesting (AWH) is a decentralized water technology that dehumidifies air to provide water. When atmospheric water is condensed, other atmospheric particles and gases can enter the liquid water. For AWH to serve as drinking water, it is necessary to understand how these air constituents interact with water as it condenses and the resulting water quality. The objectives of this research were to determine: i) the variation of measured air and water quality contaminants at two sites, and ii) the extent of interaction between particulate matter concentration in the air and the water quality of atmospherically harvested water. This study performed AWH using compressor dehumidifiers at industrial and urban ambient air quality monitoring sites in Albuquerque, New Mexico, USA. Air contamination was greater at the industrial site compared to the urban site (range PM2.5 urban 1.3 – 33.4 μg/m3, industrial 1.8 – 127.5 μg/m3; range PM10 urban 3.7 – 99.2 μg/m3, industrial 4.4 – 1525 μg/m3). Water trace metals concentrations and turbidity were also greater at the industrial site. Aluminum concentrations ranged 22.9 – 600 μg/L (urban) and 22.1 – 1560 μg/L (industrial); Iron ranged 0.5 – 363 μg/L (urban), 3.4 – 828 μg/L (industrial); Manganese ranged 0.7 – 23.7 μg/L (urban), 1.3 – 69.2 μg/L (industrial); and turbidity ranged 0.3 – 28 NTU (urban), 0.5 – 52 NTU (industrial). Water quality exceeded U.S. EPA regulations for aluminum (39 % of samples at urban site, and 90 % of samples at industrial site > 200 µg/L) and turbidity (96 % at urban site, 100 % at industrial site > 0.3 NTU). A linear mixed-effects statistical model showed water quality was a function of air quality, but for only some parameters. At the industrial site, there was a strong positive relationship between PM2.5 and some metals (aluminum, calcium, iron [p<0.05]), and marginal significance with other metals (potassium, zinc [p<0.1]). At the urban site, there was only a strong positive relationship between PM2.5 and calcium. Large variations in PM concentrations and site differences in their characteristics could play an important role in how much of metals in the air enters atmospherically harvested water. Findings from this study can guide research on understanding if air quality can be used to predict AWH water quality, provide insight to further understand the mechanisms of interaction between gas-phase water and particles as they move from the air to condensed water, and drive treatment decisions to meet water quality goals.

Graphical abstract

Image, graphical abstract

Keywords

Dehumidification

Condensation

Aerosols

Water vapor

Pollutants

1. Introduction

Global warming and the increased variability and intensity of natural disasters (e.g., floods, droughts, wildfire) are a continuing concern to water supplies. Any of these natural disasters can impact municipal water supplies and limit access for weeks to months. The atmosphere is an alternative freshwater reservoir that contains 12,900 km3 of water (Shiklomanov, 1991), is universally accessible, and can serve as a water source when other supplies are inaccessible. Atmospheric water harvesting (AWH) can condense this available water vapor to provide access to water for communities in need during emergencies (Gayoso et al., 2024; Mulchandani and Westerhoff, 2020).

There are few studies on AWH water quality, and the relationship between air quality and water quality has only been minimally investigated for both condensation and sorption-based systems (Mulchandani et al., 2022; Zeng et al., 2024). These AWH water quality studies are often performed at a single site for around 12 months (Mulchandani et al. 2022), while few have studied AWH across multiple sites and months (Xia et al., 2015). These studies find turbidity, aluminum, iron, and manganese concentrations above United States Environmental Protection Agency (U.S. EPA) and World Health Organization (WHO) drinking water regulations in untreated AWH water, and aluminum and iron above regulatory values in treated AWH water (Zeng et al., 2024). As more studies are performed, it is apparent that there may be large variability in concentrations of metal and organic contaminants over space and time. The concentration of these contaminants may be impacted by variability in air quality, but this influence is not well studied. Xia et al. (2015) studied the relationship between particulate matter (PM) and ion contaminants in condensation-based atmospherically harvested water and found high concentrations of Cl–, SO42-, NH4+ and Ca2+ in industrial areas associated with soil dust and exhaust. This study was performed in a temperate climate (relative humidity ranged 60–80 %), and it is unknown whether these results are transferable or universal for all climate zones and pollution sources, specifically those experienced in more arid regions. For AWH to be considered a viable drinking water source in multiple regions, more data is needed to understand the extent and nature of air quality influence on AWH water quality. Spatial and temporal analysis across environments (e.g., arid with heavy agricultural and urban emissions sources, vs humid with heavy industrial emissions) is needed to determine the full range of potential water quality.

Air quality is influenced by natural and anthropogenic emissions of trace gases and aerosols as well as meteorological factors such as temperature, wind speed, and humidity. As such, air quality can vary across a geographic region and changes throughout the day (Hosein et al., 1977). The U.S. EPA classifies and measures outdoor air pollution by 6 criteria pollutants: ozone (O3), carbon monoxide (CO), nitrogen dioxide (NO2), sulfur dioxide (SO2), lead (Pb) and particulate matter (PM) pollution (US EPA, 2015a). Of these pollutants, PM may be most likely to influence chemical makeup of AWH water quality due to the interaction between PM and gas phase water in the atmosphere.

Fig. S1 shows how PM and gas-phase water interact in the atmosphere. PM is formed through nucleation, accumulation and coarse modes. In nucleation mode, particles are freshly formed through combustion or atmospheric reactions from emissions sources such as traffic, industry and burning (EPA, 2023). These particles grow through coagulation with water vapor and other constituents to get to accumulation mode. As small particles stick together, the total particle number decreases, and the mass and surface area of each coagulated particle increase. Lastly, coarse mode generally consists of mechanically separated particles that may be resuspended from surfaces. PM is classified as fine (<2.5 m) and coarse (<10 m) and is often made up of clusters of different constituents depending on the emissions that influence the air quality (EPA, 2019). PM2.5 typically contains crustal material comprising of metal compounds (Al, Cu, Fe, K, Mn, etc.), soil, small liquids, elemental carbon, volatile organic compounds and various ions (SO42- and NO3–) (Chemical Elements, Minerals, Rocks, 2024; EPA, 2023; Hasheminassab et al., 2014). PM10 is typically produced by surface abrasion, sea spray, biological materials, and road, crop and livestock dust (EPA, 2023). Water vapor in the air continue to interact with particulates, which may partition with water vapor into condensed AWH waters. We theorize that when this water vapor condenses within an AWH system, particles of all sizes from various sources (e.g., traffic, industry and burning) containing constituents such as metals, carbon and gases will be collected in the harvested water and impact water quality.

Currently, there is a knowledge gap regarding the relationship between PM concentrations and characteristics, and subsequent water quality of AWH, particularly as it varies by space and time to determine site specific impacts. These relationships may vary as a function of location, climate, and air quality. Closing this gap can provide key insight on the level and type of treatment required to make AWH a viable drinking water source. If there is a significant relationship between air quality measured as PM and water quality, air could be pre-filtered to remove PM before harvesting. Alternatively, post-harvesting water treatment may be applied to remove both particles and dissolved constituents.

The objectives of this research were to determine: i) the variation of measured air and water quality contaminants by site, and ii) the extent of interaction between particulate matter concentration in the air and the water quality of atmospherically harvested water. Condensation-based AWH devices were operated in a semi-arid high-desert metropolitan city. AWH devices were co-located with air quality monitoring instrumentation to directly compare air quality with AWH water quality. The air was not pre-filtered, and AWH water samples were not filtered or treated in order to gain a full understanding of the impact of PM on water quality. We hypothesized that air pollution and AWH water pollution would be greater at the industrial site compared to the urban site. Secondly, we hypothesized that there would be a positive linear relationship between both PM10 and PM2.5 and total organic carbon and metal concentrations, the nature of which may be specific to each site. Findings from this study can guide research on understanding if PM can be used to predict AWH water quality, provide insight to further understand the mechanisms of interaction between gas-phase water and particles as they move from the air to condensed water, and drive treatment decisions to meet water quality goals.

CLICK HERE FOR MORE INFORMATION

https://www.sciencedirect.com/science/article/pii/S0043135425011200?via%3Dihub

Assessment of water quality and health hazards using water quality index and human health risk evaluation in district Talagang Pakistan

Scientific Reports volume 15, Article number: 5191 (2025) Cite this article

Abstract

This work was carried out for the determination of the water quality in the Talagang District of Pakistan, as water is essential for agriculture and drinking uses. This study aims to assess the water quality for irrigation, drinking, and health risks using the Water Quality Index (WQI) and Human Health Risk Assessment (HHRA) tools to identify regions with contaminated water, and to evaluate the associated risks. A total of 98 water samples were taken at various points from diverse sources such as hand pumps, streams, springs, dug wells, and tube wells for physio-chemical assessment. In the current study, the effectiveness of the irrigation water quality index (IWQI), human health risk assessment (HHRA), and water quality index (WQI) tools have been assessed. The characteristics of subterranean water are influenced by evaporation, ion exchange, rock-water interaction, and parent-rock weathering, as shown by the Piper and Gibbs diagram. According to the WQI results, the water quality is 20. 89% and 27.46% of the sample sites are moderate and poor, making them unfit for human intake. Based on HHRA, compared to adult males and females in the study area, children are deemed to be at a higher risk. A larger number of the sample localities are appropriate for irrigation purposes. The study assists in identifying contaminated regions and in monitoring newly implemented remediation actions to manage the source of contaminants in the study area.

Hydro-chemical profiling and contaminant source identification in agricultural canals using data driven clustering approaches

Article Open access10 July 2025

New approach to predict wastewater quality for irrigation utilizing integrated indexical approaches and hyperspectral reflectance measurements supported with multivariate analysis

Article Open access12 May 2025

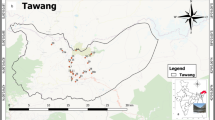
Evaluation of water quality index and geochemical characteristics of surfacewater from Tawang India

Article Open access09 July 2022

Introduction

Surface and subterranean water are essential sources of drinking, farming, industrial, and domestic uses worldwide and also have a substantial effect on shaping the quality of lives and sustainability of societies1. Due to rapid growth and population increase, natural and human actions such as industry, urbanization, mining, and agriculture have resulted in water depletion and impairment issues2,3. Water quality degradation and depletion have emerged as significant global challenges, directly impacting public health, agriculture, and the environment4,5. The poor quality of water poses both direct and indirect health risks to the communities that rely on it, often leading to substantial public health issues and increased costs for water treatment and rehabilitation6. Direct health risks are associated with the consumption of contaminated water, such as heavy metal contamination, which can cause serious illnesses7,8. Indirect health risks occur when contaminated water is used for irrigation, affecting agricultural crops, horticulture, and aquaculture, leading to bioaccumulation of toxins in the food chain9.Heavy metals including Zn, Cu, and Mn are naturally occurring in water in trace amounts and are significantly essential for human metabolism and the growth of living things10. However, excessive amounts of these metals pose chronic and acute health issues. Other heavy metals including Pb, Cd, As, Cr, and Ni are severely toxic although in very low concentrations11. For example, the higher concentration of Pb is known to harm the development of the brain in children. Exposure to elevated concentrations of Cd causes chronic and acute diseases such as skeletal and kidney damage. The As causes many health problems in humans such as skin lesions, and cancer of the liver, brain, stomach, and kidney12,13. Higher intakes of Cr and Ni have been linked with liver, kidney, and heart problems14. The WQI is a handy means for evaluating the quality of water that is appropriate for residential practice. The weighted arithmetic and integrated WQI are extensively used in India for assessing surface and subterranean water because it yield results with greater accuracy1516. investigatedthe chemistry and quality index of groundwater in northwest China and noticed that 11.43% of sample locations had poor water quality, and 17.14% had very poor water quality. Similarly17, used weighted overlay analysis to assess groundwater quality for drinking and irrigation purposes in Bangladesh, revealing that 90% of water from deep wells and 57.6% from shallow wells were suitable for human consumption, according to the Drinking Water Quality Index (DWQI).

Several recent studies have employed various techniques to assess water quality, including the use of WQI, which integrates multiple physicochemical variables into a single dimensionless value representing overall water quality18,19,20,21,22. The WQI is an assessment model that can be used for integrating a variety of physicochemical variables into a dimensionless value that may depict the overall quality of the water18,20. n Pakistan, water quality contamination has been reported in several regions, affecting both surface and groundwater resources11. Given the importance of water for human health, agriculture, and overall well-being, it is crucial to evaluate the water quality in various regions. The primary objective of this study is to assess the surface and subsurface water quality for irrigation, drinking, and health risks in Talagang District, Pakistan, using the Water Quality Index (WQI) and Human Health Risk Assessment (HHRA) tools. This research aims to evaluate the hydro-chemical parameters of groundwater in the study area for both irrigation and drinking purposes, and to assess the associated health risks using the WQI and HHRA models. The findings will contribute to identifying areas where water quality poses health risks and help in formulating strategies for water management and remediation.

CLICK HERE FOR MORE INFORMATION

https://www.nature.com/articles/s41598-025-89932-y?

Health risk assessment of groundwater use for drinking in West Nile Delta, Egypt

Scientific Reports volume 15, Article number: 7414 (2025) Cite this article

Abstract

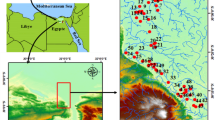
Human health is at risk from drinking water contamination, which causes a number of health problems in many parts of the world. The geochemistry of groundwater, its quality, the origins of groundwater pollution, and the associated health risks have all been the subject of substantial research in recent decades. In this study, groundwater in the west Rosetta Nile branch of the Nile Delta Aquifer is examined for drinking potential. Numerous water quality indices were applied, such as water quality index (WQI), synthetic pollution index (SPI) models, and health risk assessment (HRA) method. The limits of the measured parameters are used to test its drinking validity on the basis of WHO recommendations. TDS in the southern regions is within the desirable to allowable limits with percent 25.3% and 29.33%, respectively. Nearly all the study area has desirable value for HCO3, Al and Ba. Ca and Mg have desirable values in the center and south portion of the investigated area, whereas in the north are unsuitable. Na, Cl and SO4 fall within the desired level in the regions of the south but become unsuitable towards the north. Mn and NO3 are inappropriate except in the northwestern part. Fe is within suitable range in the southwestern and northwestern regions. Pb, Zn, Cu, and Cd were undetected in the collected samples. Regarding to WQI the study area is classified into 4 classes good, poor, very poor and unfit for drinking water from south to north. According to SPI model, 20%, 18.7%, 18.7%, 8% and 34.6% of water samples are suitable, slightly, moderately, highly polluted and unfit, respectively from south to north. Based on HRA, Children are the most category endangered with percent 14.7% of the overall samples obtained, followed by females and males with percent 12% and 8%, respectively. This study offers insights into the conservation and management of coastal aquifers’ groundwater supplies. These findings have significant implications for developing strategies and executing preventative actions to reduce water resource vulnerability and related health hazards in West Nile Delta, Egypt.

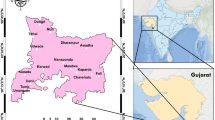
Sustainable groundwater management through water quality index and geochemical insights in Valsad India

Article Open access13 March 2025

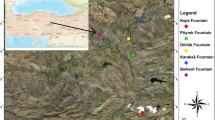
Spatiotemporal variations in the levels of toxic elements in drinking water of Sivas, Türkiye, and an ecotoxicological risk assessment

Article Open access24 March 2025

A decadal analysis of drinking water quality and nitrate-related health risk assessment in groundwater sources: a case study of Poldasht County, Northwest Iran

Article Open access05 February 2026

Introduction

In recent years, rapid urbanization and population growth, stress on natural resources, and global climate change have caused the demand for water to increase. Sustainable water resource management is becoming increasingly important to meet this demand. It is critical to manage water resources globally since groundwater is essential for meeting human needs and for sustaining life1,2,3,4. Furthermore, unregulated exploitation of groundwater resources has resulted in water shortages over recent decades, which has adversely affected groundwater quality and levels5,6,7,8,9,10. Salinization is a significant issue in many coastal regions globally, particularly in semi-arid and arid areas. It is seen as a crucial and visible issue that threatens future water resources and reduces water quality. Groundwater salinization is a key concern because it restricts water availability for both agricultural and urban needs, impacting the resilience and sustainability of coastal areas. An increase in total dissolved solids (TDS) or chloride (Cl) levels is a clear indicator of salinization11,12,13. The issue of water quality has garnered significant attention in coastal aquifers worldwide due to the aforementioned reasons for example, Thriassion Plain and Eleusis Gulf, Greece14, north Kuwait15, China15, Bangladesh16, Spain17, Mexico18, and others. As groundwater quality is equally important as its quantity, it is crucial to carefully assess it.

Heavy metals pose a toxic threat to human health and ecosystems when their concentrations surpass established limits as they can disrupt ecological systems, endanger human health, and worsen the quality of groundwater. Specific heavy metals, including copper (Cu), zinc (Zn), manganese (Mn), and chromium (Cr), are vital for metabolic processes in traces quantity, but become hazardous at high levels. In contrast, metals such as cadmium (Cd) are toxic even at minimal concentrations19,20. Tackling the presence of trace element-contaminated water resources is crucial for protecting both the ecosystem and human health21. Additionally, understanding the environmental behavior of these trace elements, including their transfer, fate, persistence, and the health risks they pose to consumers through the food chain, is vital. The health impacts of these elements are significantly influenced by factors such as their behavior, specific chemical composition, and binding state. Gaining insight into these factors is the key to assessing the potential risks of trace elements and devising effective strategies to minimize their harmful effects22,23. Controlling and mitigating these harmful effects can be achieved by monitoring heavy metal distribution, concentration, and health risks regularly.

Evaluating groundwater quality is a fundamental approach for ensuring the sustainable management of this essential resource. Various methodologies have been employed to assess groundwater quality, including stoichiometric, graphical, index-based, and inferential chemometric techniques, which are commonly used to analyze and monitor groundwater conditions and hydrogeochemical properties24,25,26. Additionally, advanced tools such as clustering, regression analysis, neural networks, and machine learning algorithms have been incorporated to observe and predict water quality trends effectively27,28,29. Given the variety of hydrochemical criteria, the water quality index (WQI) technique serves as an effective tool for evaluating groundwater quality. Due to its comprehensive calculation method, assessing groundwater quality through multiple hydrochemical parameters is considered a more reliable and robust approach. As a result, WQIs have been widely utilized in groundwater quality assessments. The most frequent techniques for assessing water quality are the WQI for drinking and synthetic pollution index (SPI). The Water Quality Index (WQI) for drinking water and the Synthetic Pollution Index (SPI) are effective tools for measuring and evaluating overall water quality, offering a more comprehensive approach than traditional techniques for evaluating the quality of water. Each of the two types of standard water quality index models (WQI and SPI) measure the cumulative impact of different physicochemical variables on groundwater quality based on weight and rate. Each physicochemical parameter is weighed according to its influence on drinking water quality30,31. Since many people rely on groundwater for drinking and other household purposes, high levels of nitrate in drinking water can result in serious health risks32,33,34. Therefore, health risk assessment (HRA) based on nitrate concentration was applied as drinking water quality criteria35,36,37. Combining water quality indices with GIS techniques provides the most effective method for detecting and visualizing changes in groundwater facies. Several studies have applied water quality indices (WQI and SPI) and HRA methods to evaluate groundwater quality for human use in various regions, and these techniques have proven successful. For instance, studies have been conducted on Makkah Al-Mukarramah Province (Saudi Arabia)38, coastal plain in Nigeria23, dumpsite in Awka (Nigeria)22, El Fayoum depression (Egypt)30, El Kharga Oasis (Egypt)39, and Central Nile Delta Region (Egypt)40.

The quaternary aquifer, coastal aquifer, is considered the main source of groundwater in the area west of Rosetta branch. Based on the previous studies, the groundwater within the study area exposed to several factors, which may lead to increase signs of groundwater quality deterioration. These factors are mainly attributed to anthropogenic activities and sea water intrusion12. Moreover, most previous studies conducted west of the Nile Delta have primarily focused on the morphological and geological features of the terrain41,42,43,44. Additionally, water sources have been examined in terms of their geochemical properties and suitability for irrigation purposes8,12,45,46. However, limited attention has been given to evaluating the quality of groundwater for drinking purposes within the study area. As a result, significant knowledge gaps remain regarding the suitability of groundwater for human consumption in this region.

Based on the aforementioned objectives, this study aimed to evaluate the quality of groundwater for drinking purposes in the region west of the Nile Delta’s Rosetta branch. This study was conducted to develop geospatial maps of physicochemical parameters in groundwater to determine the quality suitability of drinking water. Furthermore, in order to assess the water quality from the aspect of human health, two typical water quality index models are used, namely water quality index (WQI) and synthetic pollution index (SPI). In order to analyze the data concerning water quality, descriptive statistics and correlation matrices were applied. Eventually, human health risk (HRA) was assessed in the study region via contaminated water consumption by adults (males and females) and children. It is expected that this study will assist decision makers in identifying vulnerable zones and optimizing monitoring networks for groundwater quality.

CLICK HERE FOR MORE INFORMATION

https://www.nature.com/articles/s41598-025-90477-3?

Development, agriculture present risks for drinking water quality

Date:May 6, 2025

Source:North Carolina State University

Summary:Converting forest land to urban development or agricultural use can present risks to water quality when done near streams or river sources. This study examined data from 15 water treatment plants in the Middle Chattahoochee watershed to model the impacts of four potential land use scenarios several decades into the future.Share:


FULL STORY


A new study from North Carolina State University researchers finds that conversion of forests to urban development or agriculture near streams can have harmful effects on water quality downstream, presenting both health concerns and raising the cost of water treatment.

Using a model called the Soil and Water Assessment Tool, researchers mapped out the current and projected future effects of four land-use scenarios at 15 water intake locations across the Middle Chattahoochee watershed in Georgia and Alabama. By combining a series of potential socioeconomic outcomes and climate change models reaching out to 2070, researchers examined several potential land use change scenarios to predict their effects on water quality.

Katherine Martin, associate professor in the NC State University College of Natural Resources and co-author of a paper on the study, said that in models where forest cover was converted to other land uses, water quality suffered.

“In terms of aspects of water quality that we have long term data on, two of the biggest are nitrogen levels and the amount of sediment in the water. Looking at those two, in places where we’re losing forest cover, we see both of those increasing,” she said. “Those are both detrimental to the quality of drinking water, and they require more filtration.”

Part of the issue, Martin said, is the relatively high level of fertilizer used in large-scale agriculture. Urban development results in large areas of impermeable surfaces, where rainwater cannot soak into the ground and instead runs off into rivers and streams. This causes the water to carry more sediment into those waterways than it would if it had been absorbed into the ground.

Increased filtration has several knock-on effects, Martin said. Not only is it potentially harmful for aquatic life, but it also increases the cost of managing water treatment plants. For facilities that do not serve large populations, this can lead to large per-capita price increases that end up being passed on to residents. These areas are also more likely to see increased development, due to their abundance of open land. The study suggests that more attention should be paid to where development might have serious effects on water quality for people living nearby, Martin said.

“Agriculture and urban development are beneficial, and this study does not say otherwise,” she said. “What we are seeing is that there are tradeoffs when we lose forest cover, and we need to open up the conversation about those.”

This work was supported by the U.S. Department of Agriculture Forest Service Southern Research Station agreement number 20-CS-11330180-053.

CLICK HERE FOR MORE INFORMATION

https://www.sciencedaily.com/releases/2025/05/250506131518.htm?