Journal of Exposure Science & Environmental Epidemiology volume 34, pages1–2 (2024)Cite this article
- 4865 Accesses
- 11 Citations
- 17 Altmetric
- Metricsdetails
Populations worldwide are exposed to a myriad of chemicals via drinking water, yet only a handful of chemicals have been extensively evaluated with regard to human exposures and health impacts [1, 2]. Many chemicals are generally “invisible” in that they do not alter the color or odor of drinking water, and many of the associated effects are not observable for decades, making linkages between exposure and disease difficult. The articles included in the Journal of Exposure Science and Environmental Epidemiology Special Topic “Assessing Exposure and Health Consequences of Chemicals in Drinking Water in the 21st Century” cover a range of topics, including: (i) new exposure and health research for regulated and emerging chemicals, (ii) new methods and tools for assessing exposure to drinking water contaminants, (iii) issues of equity and environmental justice, (iv) drinking water issues within the context of a changing climate. This Special Topic includes articles authored by experts across multiple disciplines including environmental engineering, hydrology, exposure science, epidemiology, toxicology, climate science, and others. Many of these papers emerged from an international symposium organized by ISGlobal and Yale scientists held in Barcelona in September 2022 [3].
Regulated chemicals
Chemicals that have been the focus of environmental health research include disinfection by-products (DBPs), nitrate, and metals. Although many of these chemicals are regulated, there is concern about low-dose exposures at concentrations below standards and guidelines, and risks of health endpoints not yet studied. Kaufman et al. explore new ways to assess DBP exposure, considering concentrations and specific toxicity potential in relation to birth defects risk [4]. Long-term exposure to DBPs and nitrate is addressed by Donat-Vargas et al. in relation to chronic lymphocytic leukaemia in Spain [5]. Friedman et al. examine temporal and spatial variability of manganese concentrations in a case study in the United States (US) [6]. Hefferon et al. evaluated sociodemographic inequalities in fluoride concentrations across the US [7]. Spaur et al. evaluate the contribution of water arsenic to biomarker levels in a prospective study in the US [8].
Chemicals of emerging concern
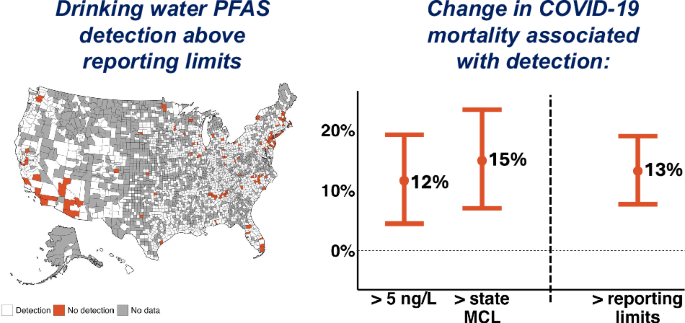
Many emerging chemicals, such as per- and polyfluoroalkyl substances (PFAS), microplastics, and 1,4-dioxane, have drinking water as the dominant exposure pathway for many populations. Yet, these remain largely unregulated or have standards and guidelines that vary widely across states and countries. Because only small percentages of the universe of contaminants are regulated in drinking water, routine monitoring data for many chemicals of emerging concern is frequently absent or very limited. To advance understanding of drinking water exposures to PFAS, Cserbik et al. [9]. and Kotlarz et al. [10]. evaluate and compare PFAS in drinking water and blood serum samples in two different settings: an urban setting not impacted by PFAS pollution in Spain [9] and among well water users living near a fluorochemical facility in the US [10], respectively.
New methods and tools for exposure assessment
There is a need for improved tools, methods, and data to evaluate drinking water related exposures. These tools and techniques remain somewhat limited and lag behind those of other stressors (e.g., air pollution). Also, despite water contaminants occurring in mixtures, most of the evaluations (and policies and regulations) are conducted chemical by chemical, ignoring potential interactions. Schullehner et al. present case studies of three approaches of exposure assessment of drinking water quality: use of country-wide routine monitoring databases, wide-scope chemical analysis, and effect-based bioassay methods [11]. Luben et al. elaborate and compare different exposure assessment metrics to trihalomethanes in epidemiological analyses of reproductive and developmental outcomes [12]. Escher et al. present in vitro assays to evaluate biological responses of including neurotoxicity, oxidative stress, and cytotoxicity in different types of drinking water samples (tap, bottled, filtered) [13] Isaacs et al. present newly developed automated workflows to screen contaminants of concern based on toxicity and exposure potential [14]. Dorevitch et al. develop a novel method to improve detection of particulate lead spikes [15].
Issues of equity, environmental justice, and vulnerable populations
A substantial portion of the population (e.g., 20% in the United States) have private water supplies (e.g., a household domestic drinking water well), which are not subject to any federal regulatory oversight or monitoring [16]. This presents an equity issue in access to data on drinking water quality, as discussed in Levin et al. [2]. and heterogeneity in state-based policies for drinking water prevention, as discussed by Schmitt et al. [17]. Spaur et al. [8], observed that water from unregulated private wells and regulated municipal water supplies contributes substantially to overall exposures (as measured by urinary arsenic and uranium concentrations) in both rural, American Indian populations and urban, racially/ethnically diverse populations nationwide. Hefferon et al. evaluated environmental justice issues with respect to fluoride and found that 2.9 million US residents are served by public water systems with average fluoride concentrations exceeding the World Health Organization’s guidance limit [7]. Friedman et al. show that manganese in drinking water frequently exceeds current guidelines in the US, and occur at concentrations shown to be associated with adverse health outcomes, especially for vulnerable and susceptible populations like children [6].
Chemical contamination may also pose a serious threat in the developing world. Today, around 2.2 billion people – or 1 in 4 – still lack safely managed drinking water at home [18]. In most of the world, microbial contamination is the biggest challenge. Because it has been understudied, the chemical risks remain obscure [19], and regulators often require local data to take action. Praveena et al. reviews the quality of different drinking water types in Malaysia (tap water, ground water, gravity feed system) and its implications on policy, human health, management, and future research [20].
Water quality in a changing climate
There is an urgent need to anticipate and prepare for current and future challenges in a rapidly changing world. We also need to foresee new challenges to address issues of water scarcity (e.g., increasing desalination, use of treated wastewater in densely populated urban areas to meet water use demands), and aging infrastructure for many middle- and high-income countries constructed in the nineteenth and twentieth centuries. The impacts of climate change on the water cycle are direct and observable, such as more frequent droughts and floods, sea level rise, and ice/snow melt. These events will challenge drinking water quality and availability through direct and indirect mechanisms [21]. There is still very limited knowledge on how climate events will affect the quality of finished drinking water. In our special issue, Oliveras et al. conducts a new analysis on the impacts of drought and heavy rain surrogates on the quality of drinking water in Barcelona, Spain [22].
Conclusion
Chemical contamination of drinking water is widespread. Although our knowledge on chemical risks in drinking water is increasing, there are knowledge gaps that make a slow translation to public health protection. We hope this issue highlights, elevates, and motivates research on chemical exposures via drinking water.
CLICK HERE FOR MORE INFORMATION


:max_bytes(150000):strip_icc():format(webp)/Fewer-Disinfection-Byproducts-BottledWater-FT-DGTL0226-bb7e2b2a08ab4dde974c35caf14eb2c9.jpg)