Long before talk of climate change, California planned a system of canals and reservoirs to carry water to its dry areas. It’s no longer enough.
Is it ‘Zero Day’ for California Water?

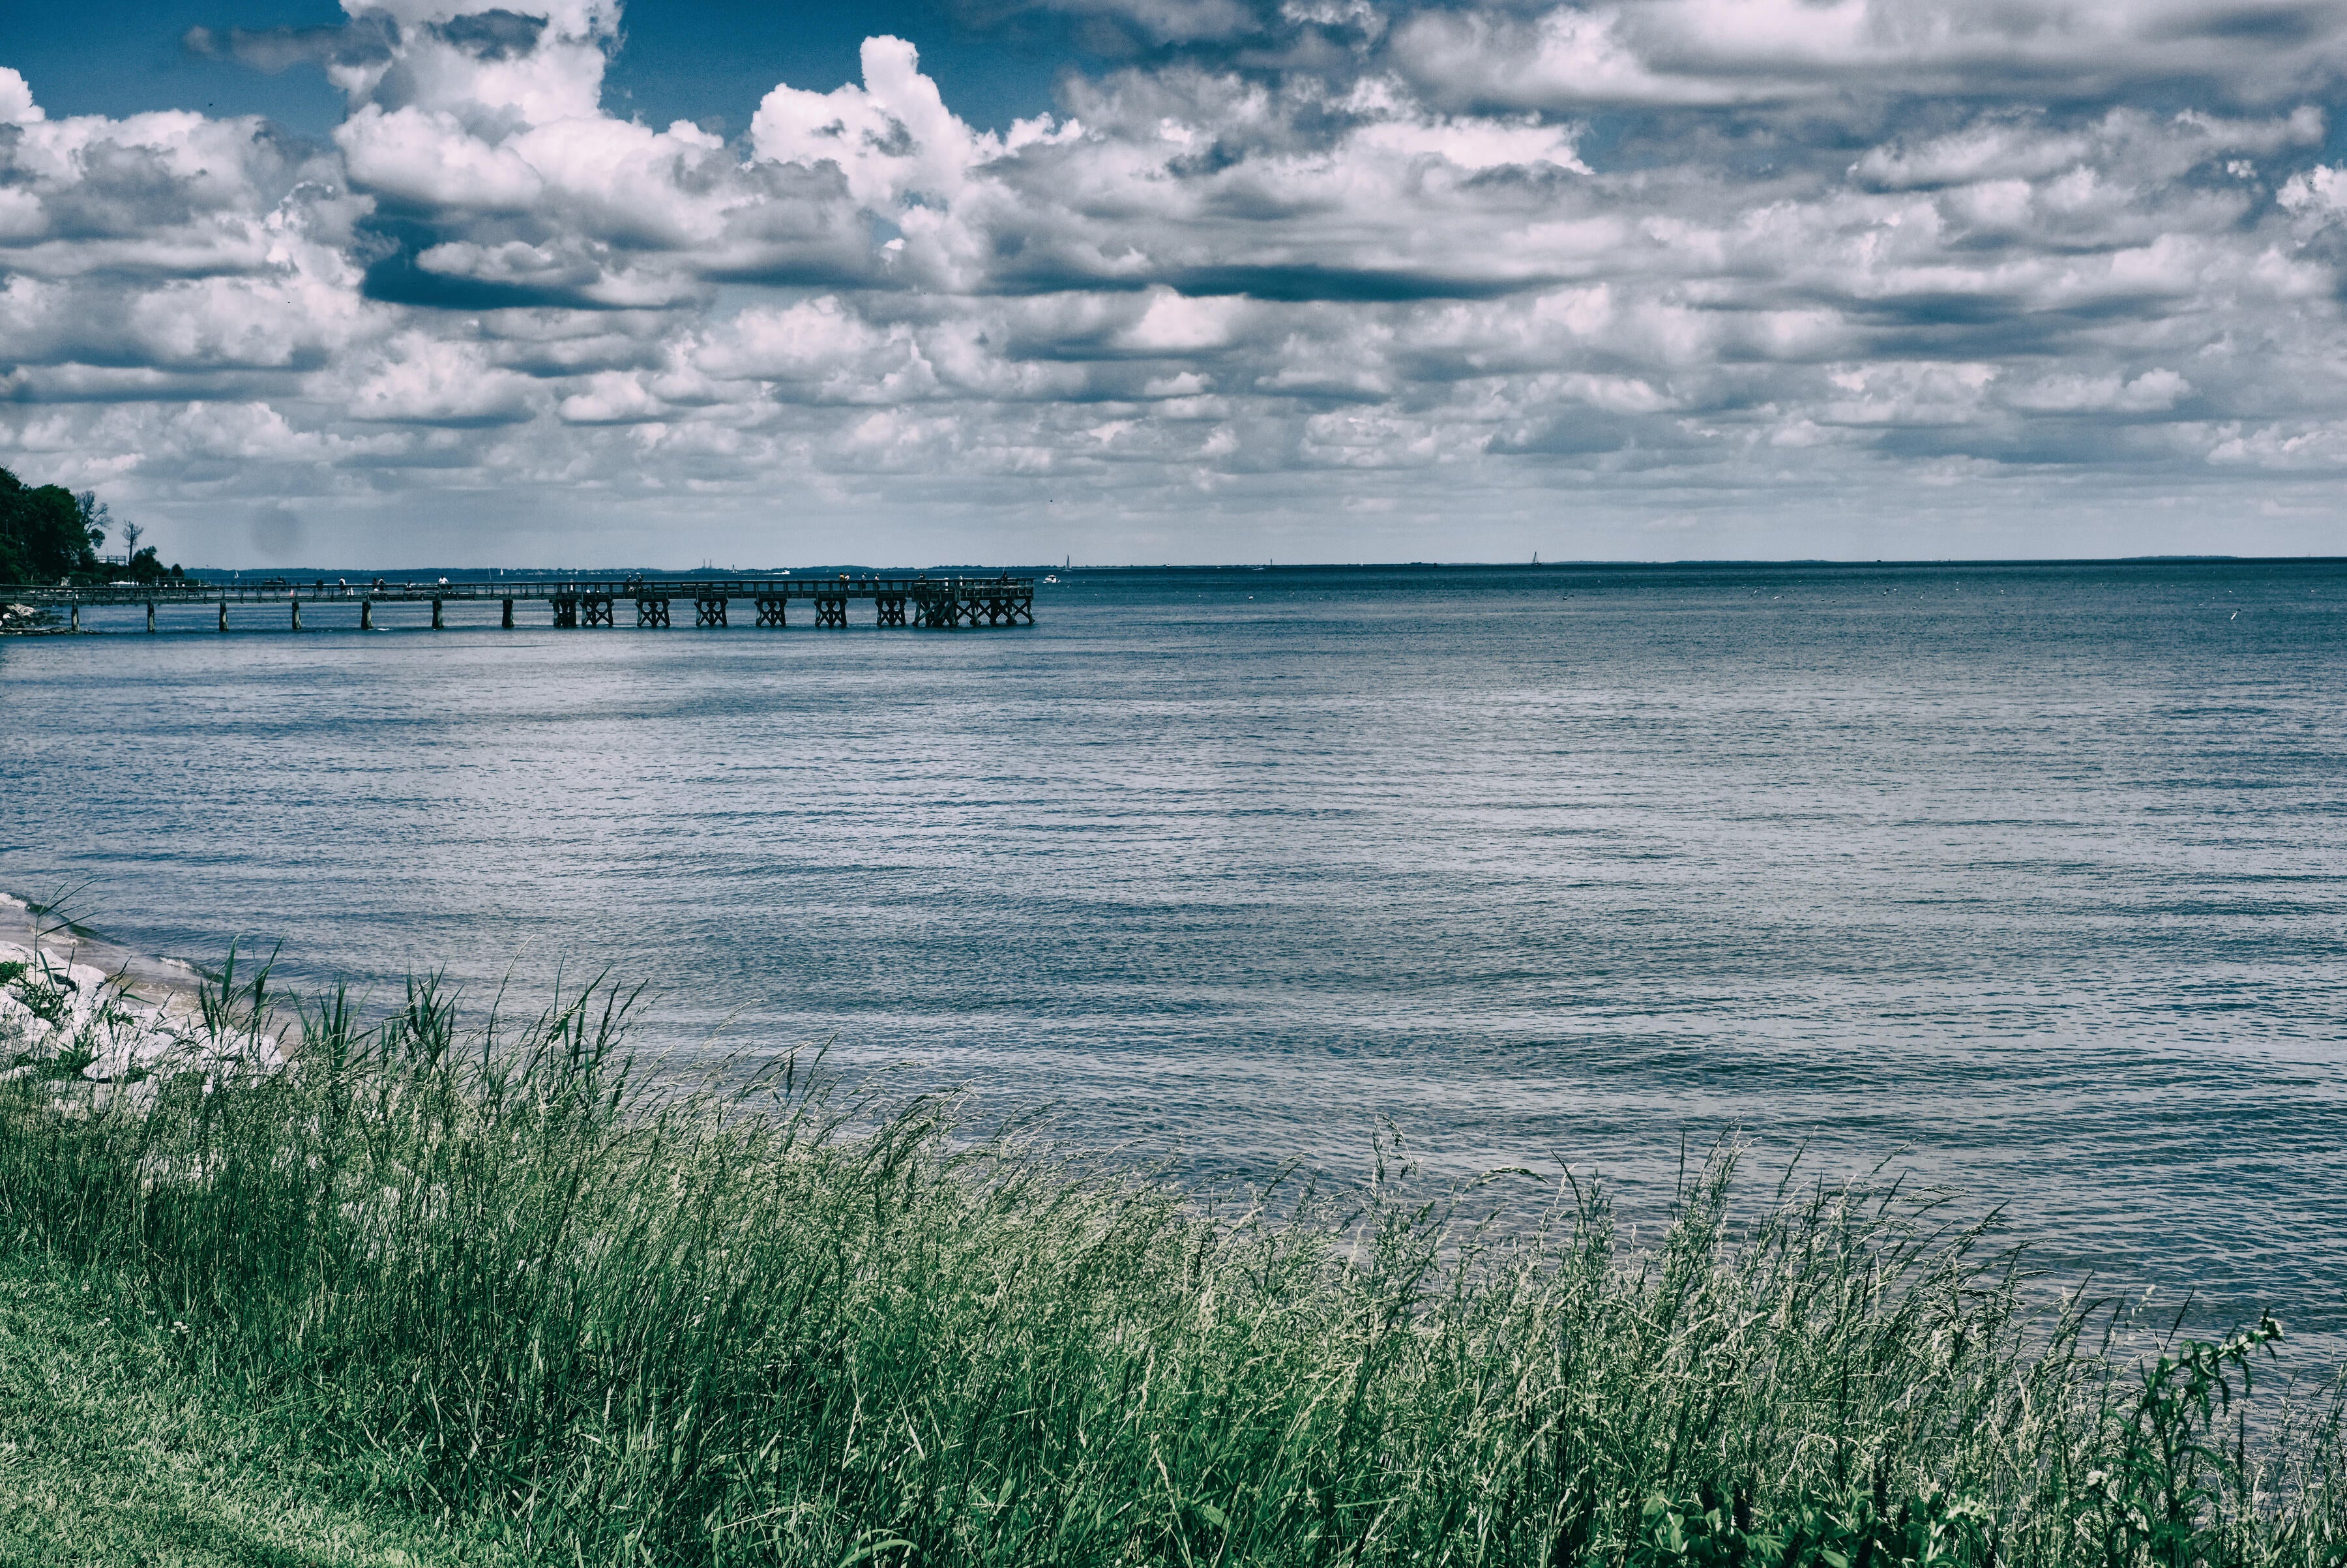
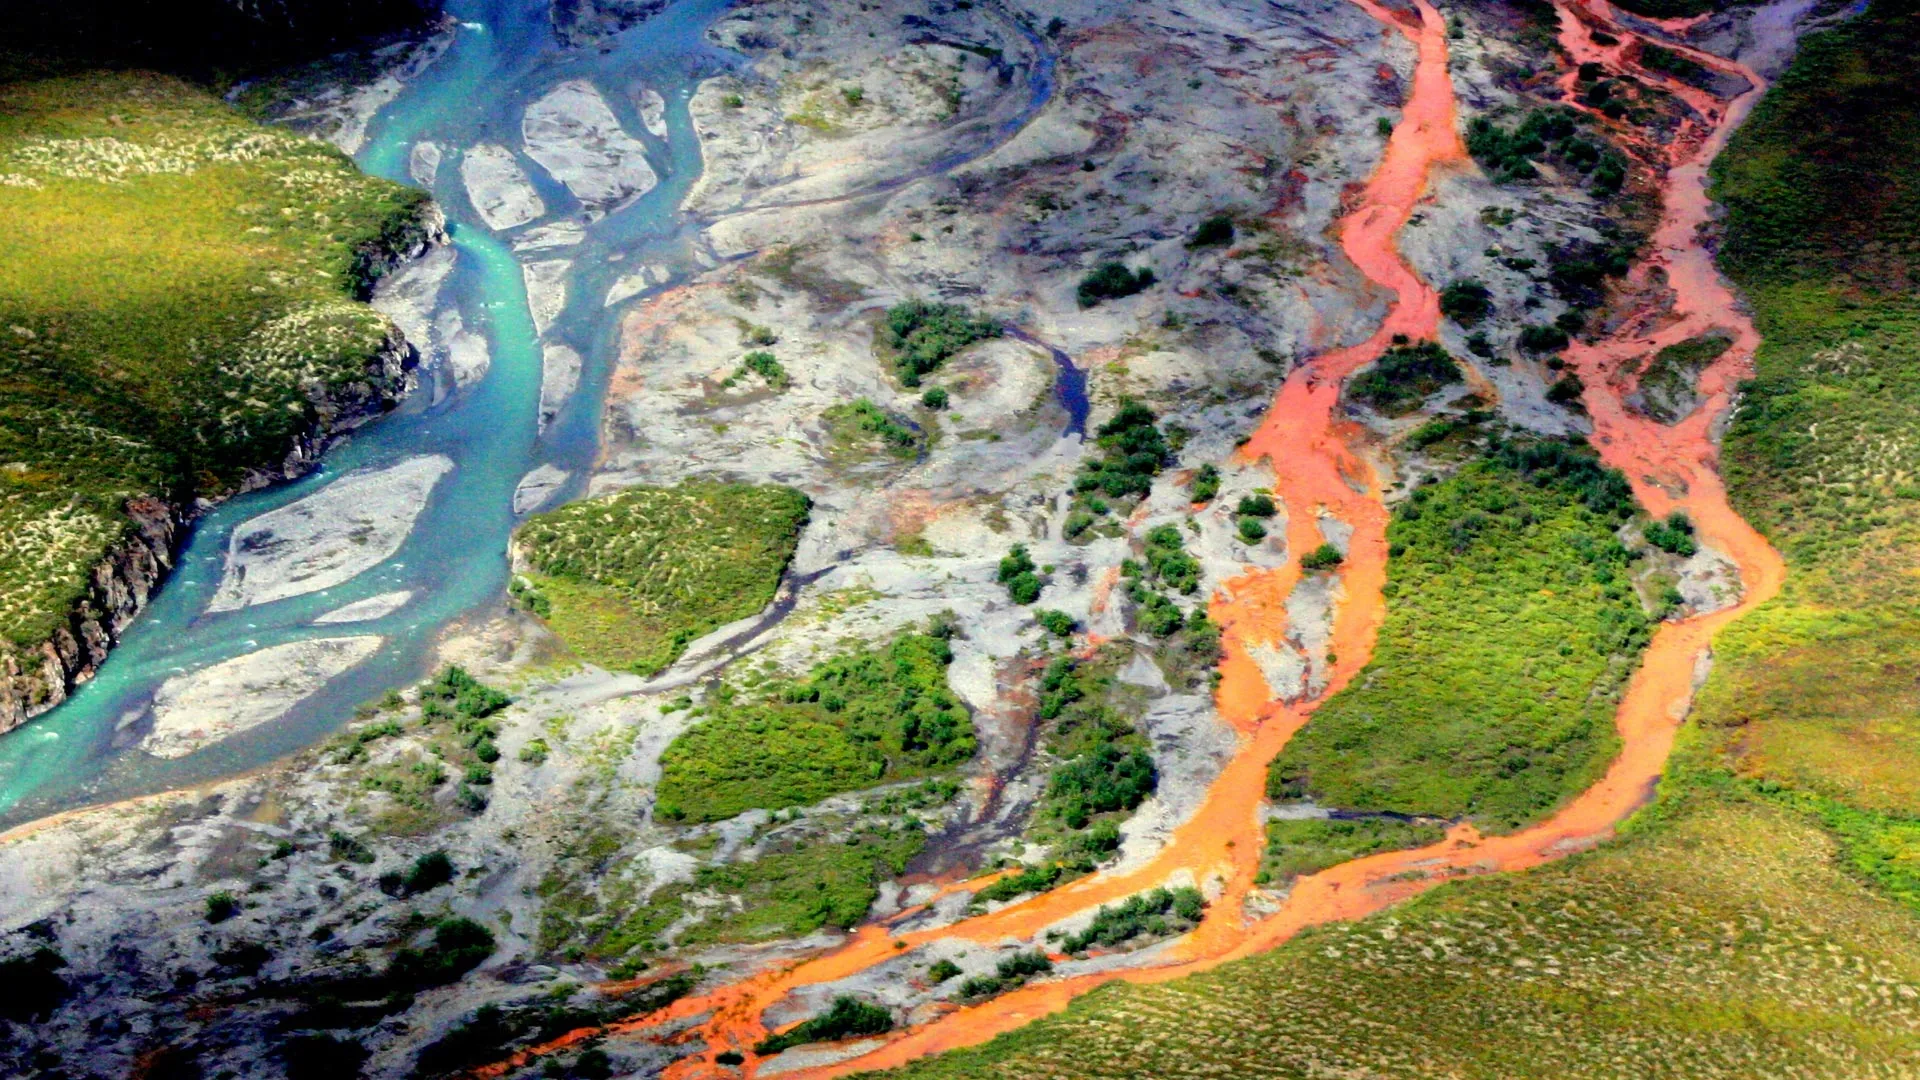
George Rose|Getty Images
A portion (looking south) of the 152-mile Friant-Kern Canal, an aqueduct to convey water to augment agriculture irrigation on the east side of the San Joaquin Valley, is viewed on July 8, 2021, thirty minutes east of Fresno, Calif.
By Lara B. Fowler
On Dec. 1, 2021, California triggered headlines heard around the world when officials announced how much water suppliers would be getting from the State Water Project. “California water districts to get 0% of requested supplies in an unprecedented decision,” one headline proclaimed. “No state water for California farms,” read another.
MORE: Solar Panels Over California’s Canals and Climate Payoff
The headlines suggested a comparison with the “Zero Day” announcement in Cape Town, South Africa, during a drought in 2018. That was the projected date when water would no longer be available at household taps without significant conservation. Cape Town avoided a water shutoff, barely.
While California’s announcement represents uncharted territory and is meant to promote water conservation in what is already a dry water year, there is more to the story.
California’s drought solution
California is a semi-arid state, so a dry year isn’t a surprise. But a recent state report observed that California is now in a dry pattern “interspersed with an occasional wet year.” The state suffered a three-year drought from 2007 to 2009, a five-year drought from 2012 to 2016, and now two dry years in a row; 2020 was the fifth-driest year on record, and 2021 was the second-driest.
Coming into the 2022 water year – which began Oct. 1 – the ground is dry, reservoirs are low and the prediction is for another dry year.
Over a century ago, well before climate change became evident, officials began planning ways to keep California’s growing cities and farms supplied with water. They developed a complex system of reservoirs and canals that funnel water from where it’s plentiful to where it’s needed.
Part of that system is the State Water Project.
First envisioned in 1919, the State Water Project delivers water from the relatively wetter and, at the time, less populated areas of Northern California to more populated and drier areas, mostly in Southern California. The State Water Project provides water for 27 million people and 750,000 acres of farmland, with about 70% for residential, municipal and industrial use and 30% for irrigation. There are 29 local water agencies – the state water contractors – that helped fund the State Water Project and in return receive water under a contract dating to the 1960s.
While the State Water Project is important to these local water agencies, it is usually not their only source of water. Nor is all water in California supplied through the State Water Project. Most water agencies have a portfolio of water supplies, which can include pumping groundwater.
What does 0% mean?
Originally, the State Water Project planned to deliver 4.2 million acre-feet of water each year. An acre-foot is about 326,000 gallons, or enough water to cover a football field in water 1 foot deep. An average California household uses around one-half to 1 acre-foot of water per year for both indoor and outdoor use. However, contractors that distribute water from the State Water Project have historically received only part of their allocations; the long-term average is 60%, with recent years much lower.
Based on water conditions each year, the state Department of Water Resources makes an initial allocation by Dec. 1 to help these state water contractors plan. As the year progresses, the state can adjust the allocation based on additional rain or snow and the amount of water in storage reservoirs. In 2010, for example, the allocation started at 5% and was raised to 50% by June. In 2014, the allocation started at 5%, dropped to 0% and then finished at 5%.
This year is the lowest initial allocation on record. According to the state Department of Water Resources, “unprecedented drought conditions” and “reservoirs at or near historic lows” led to this year’s headline-producing 0% allocation.
READ: California Water Supply Looks Promising in 2020, State Officials Say
That’s 0% of each state water contractor’s allocation; however, the department committed to meet “unmet minimum health and safety needs.” In other words, if the contractors cannot find water from other sources, they could request up to 55 gallons per capita per day of water to “meet domestic supply, fire protection and sanitation needs.” That’s about two-thirds of what the average American uses.
The department is also prioritizing water for salinity control in the Sacramento Bay Delta area, water for endangered species, water to reserve in storage and water for additional supply allocations if the weather conditions improve.
Under the current plan, there will be no water from the State Water Project for roughly 10% of California’s irrigated land. As a result, both municipal and agricultural suppliers will be seeking to conserve water, looking elsewhere for water supplies, or not delivering water. None are easy solutions.
The problem with pumping groundwater
To weather previous droughts, many water suppliers relied on groundwater, which led to increased costs for wells, declines in groundwater levels, land subsidence and degraded water quality. California’s Sustainable Groundwater Management Act was enacted in 2014 to help address overpumping of groundwater, but it hasn’t turned these conditions around.
Those who can afford to dig deeper wells have done so, while others have no water as their wells have gone dry. During the 2012-2016 drought, the Public Policy Institute of California found that a majority of affected households that lost water access from their wells were in “small rural communities reliant on shallow wells – many of them communities of color.”
Gov. Gavin Newsom called on residents to voluntarily conserve 15% of their water during summer 2021. Statewide reductions were only 1.8% in July but jumped to 13.2% in October. This year’s snowpack, which acts as a natural reservoir, is far below normal.
Irrigators who depend on the federal Central Valley Project are facing similar drought conditions. Imports from the Colorado River system are also limited, as this basin is also facing its first-ever shortage declaration due to drought.
MORE: Western States Maintain Best Air Quality Levels
What’s next?
As someone who has worked in California and the Western U.S. on complex water issues, I am familiar with both drought and floods and the challenges they create. However, the widespread nature of this year’s drought – in California and beyond – makes the challenge even harder.
This “zero allocation” for California’s State Water Contractors is an unprecedented early warning, and likely a sign of what’s ahead.
A recent study warned that the snowpack in Western states like California may decline by up to 45% by 2050, with low- and no-snow years becoming increasingly common. Thirty-seven cities in California have already issued moratoriums on development because of water supply concerns.
If voluntary conservation does not work, enacting mandatory conservation measures like San Jose’s tough new drought rules may be needed. The state is now weighing emergency regulations on water use, and everyone is hoping for more precipitation.
Lara B. Fowler, Senior Lecturer in Law and Assistant Director for Outreach and Engagement, Penn State Institutes of Energy and the Environment, Penn State
This article is republished from The Conversation under a Creative Commons license. Read the original article.
CLICK HERE FOR MORE INFORMATION