Climate change is exacerbating both water scarcity and water-related hazards (such as floods and droughts), as rising temperatures disrupt precipitation patterns and the entire water cycle.
Water and climate change are inextricably linked. Climate change affects the world’s water in complex ways. From unpredictable rainfall patterns to shrinking ice sheets, rising sea levels, floods and droughts – most impacts of climate change come down to water.
Climate change is exacerbating both water scarcity and water-related hazards (such as floods and droughts), as rising temperatures disrupt precipitation patterns and the entire water cycle.
Get more facts on climate and water below.
Water scarcity
- Over two billion people worldwide don’t have access to safe drinking water today, and roughly half of the world’s population is experiencing severe water scarcity for at least part of the year. These numbers are expected to increase, exacerbated by climate change and population growth.
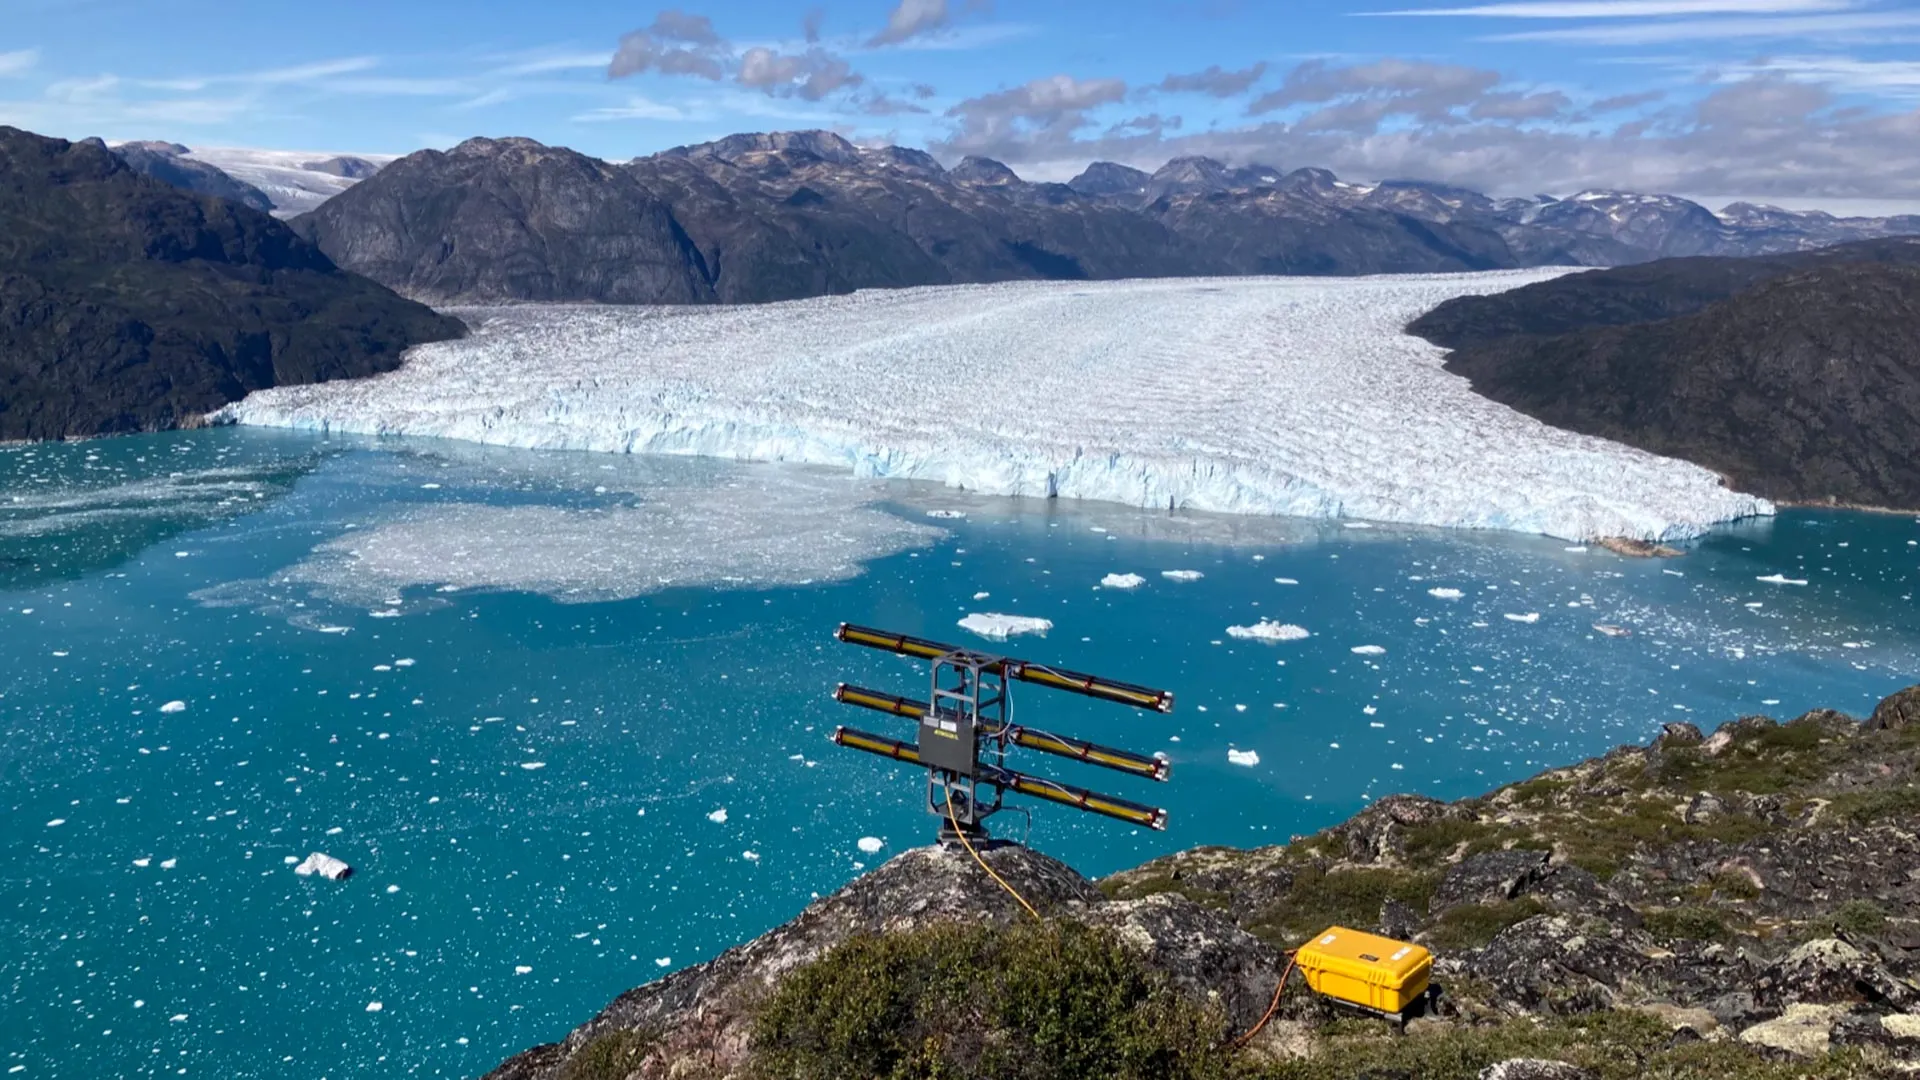
- Only 0.5 per cent of water on Earth is useable and available freshwater – and climate change is dangerously affecting that supply. Over the past twenty years, terrestrial water storage – including soil moisture, snow and ice – has dropped at a rate of 1 cm per year, with major ramifications for water security.
- Melting glaciers, snow and permafrost are affecting humans and ecosystems in mid-to-high latitudes and the high-mountain regions. These changes are already impacting irrigation, hydropower, water supply, and populations depending on ice, snow and permafrost.
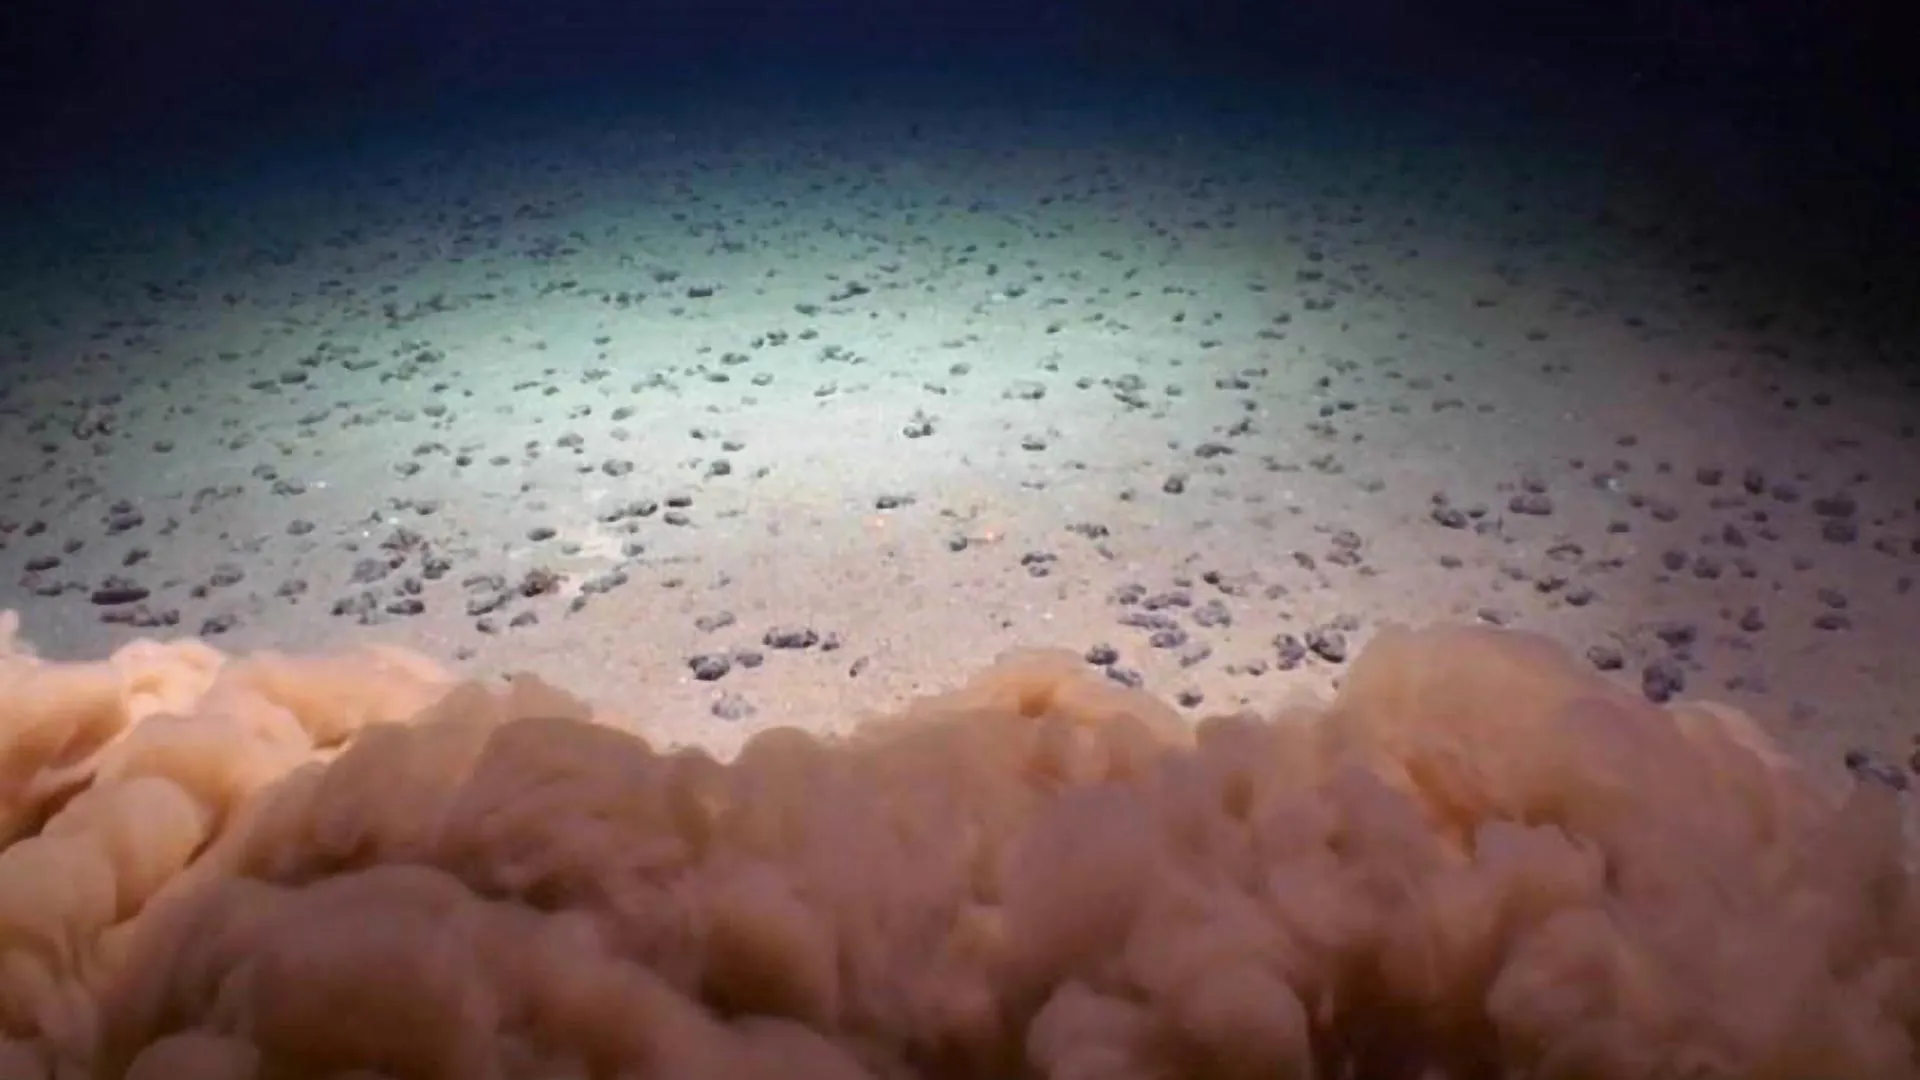
- Climate change is one of the key drivers of the loss and degradation of freshwater ecosystems and the unprecedented decline and extinction of many freshwater-dependent populations, particularly due to land use and pollution.
- Limiting global warming to 1.5°C compared to 2°C would approximately halve the proportion of the world population expected to suffer water scarcity, although there is considerable variability between regions.
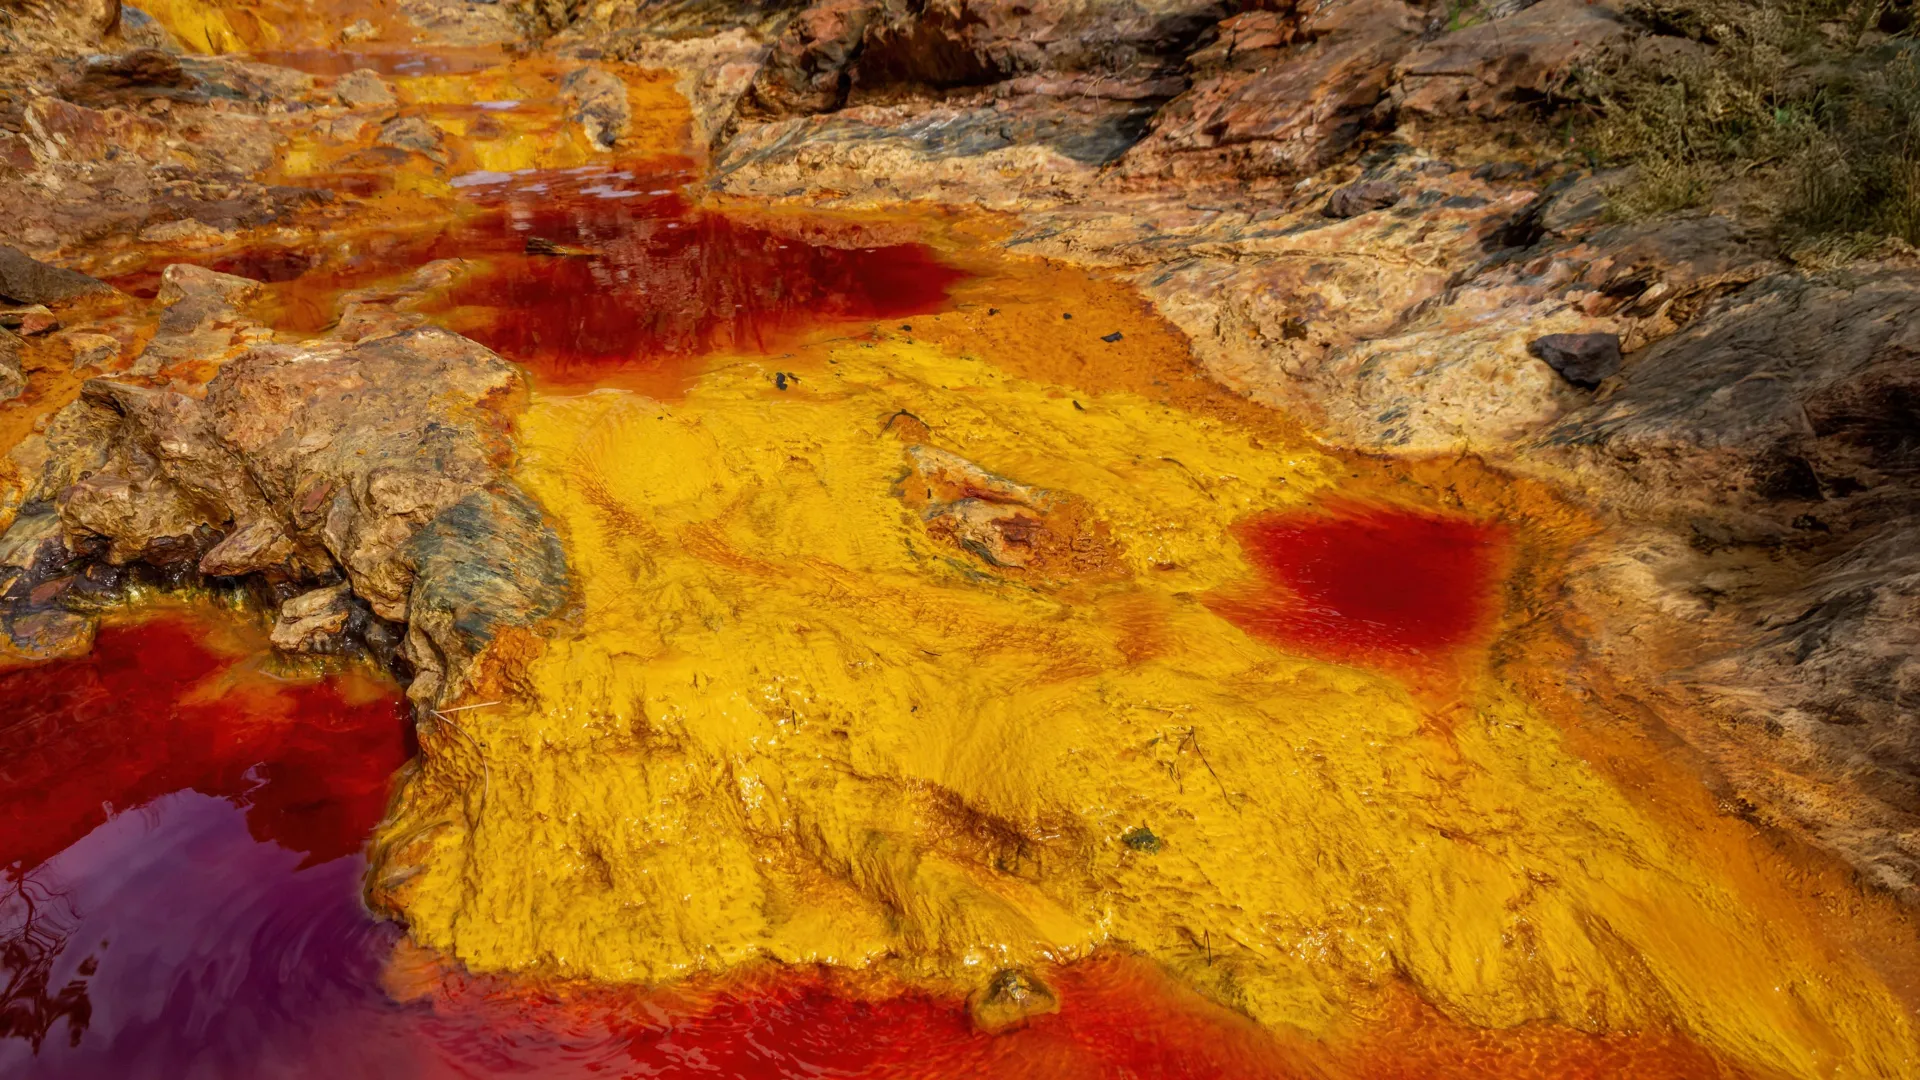
- Water quality is also affected by climate change, as higher water temperatures and more frequent floods and droughts are projected to exacerbate many forms of water pollution – from sediments to pathogens and pesticides.
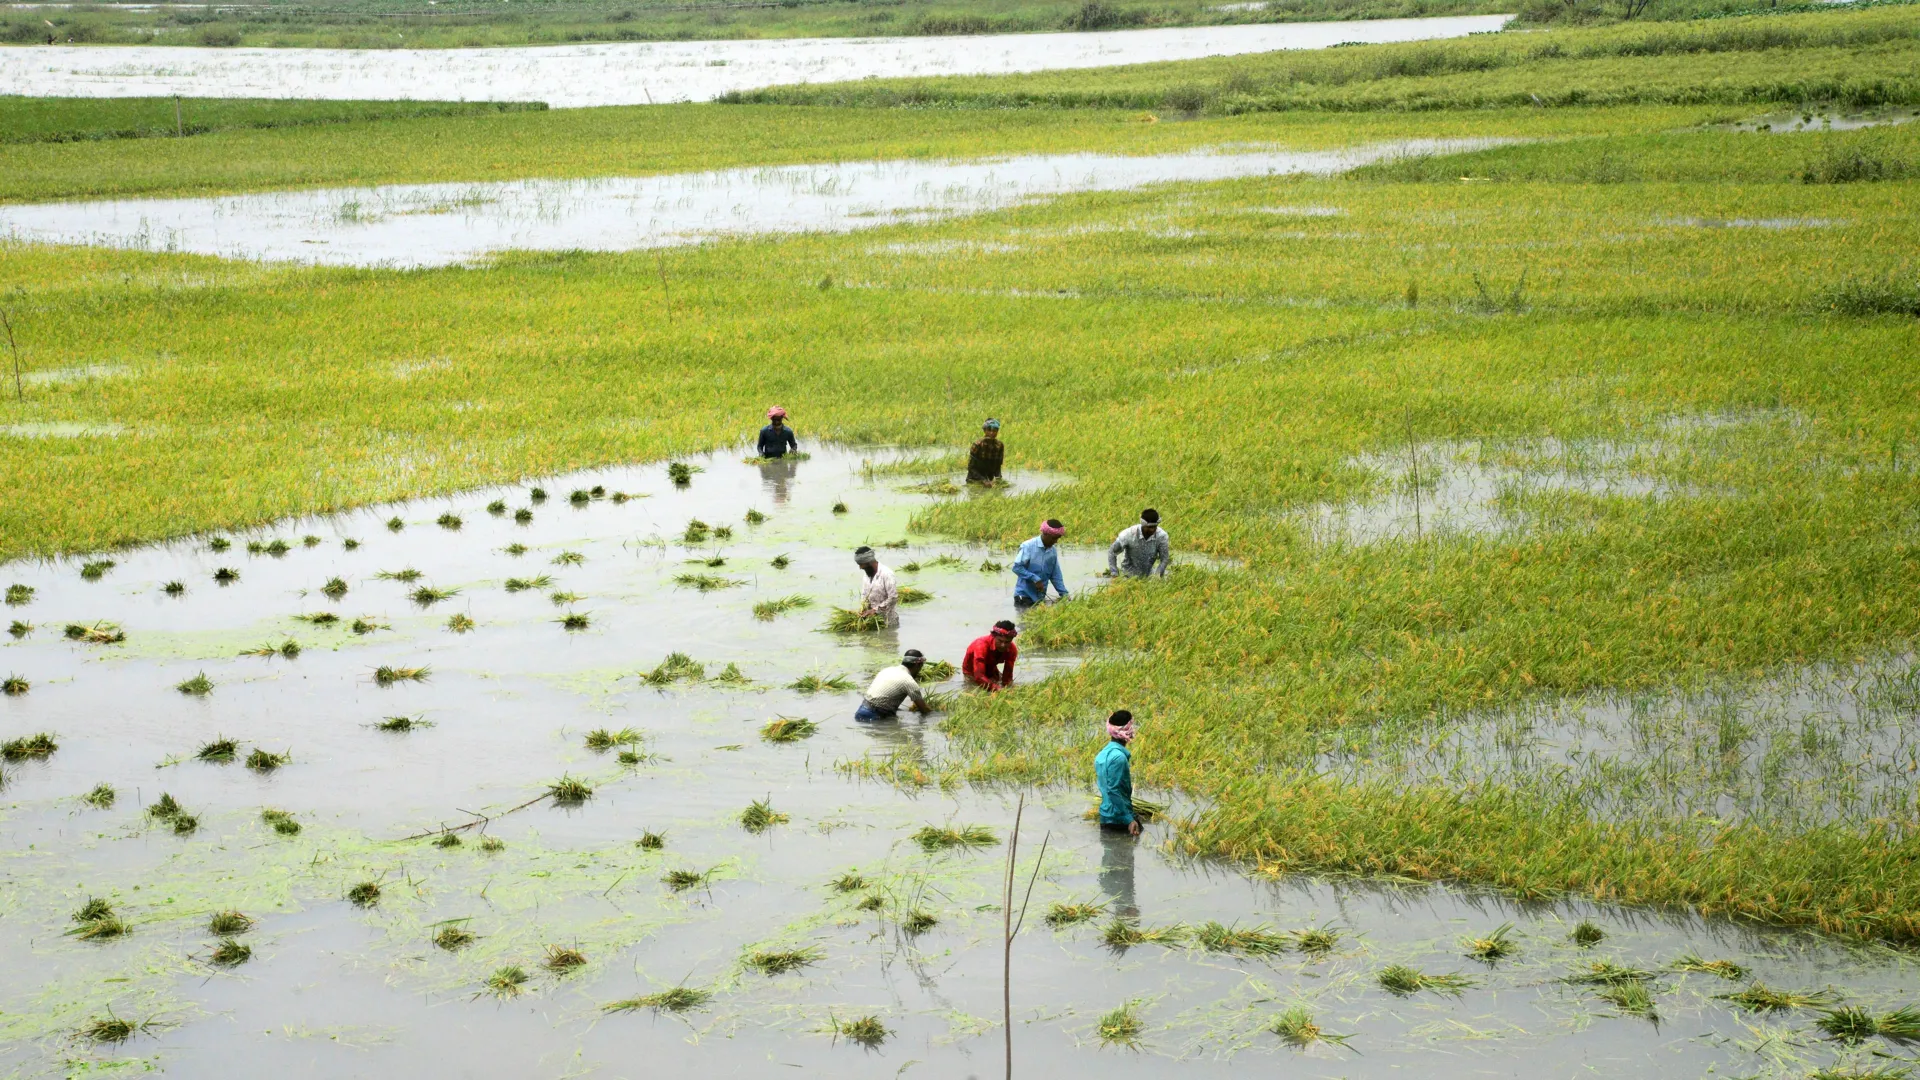
- Climate change, population growth and increasing water scarcity will put pressure on food supply as most of the freshwater used, about 70 per cent on average, is used for agriculture (it takes between 2000 and 5000 liters of water to produce a person’s daily food).
Water-related hazards
- Climate change has made extreme weather events such as floods and droughts more likely and more severe.
- Rising global temperatures increase the moisture the atmosphere can hold, resulting in more storms and heavy rains, but paradoxically also more intense dry spells as more water evaporates from the land and global weather patterns change.
- Annual mean precipitation is increasing in many regions worldwide and decreasing over a smaller area, particularly in the tropics.
- Climate change has increased the likelihood of extreme precipitation events and the associated increase in the frequency and magnitude of river floods.
- Climate change has also increased the likelihood or severity of drought events in many parts of the world, causing reduced agricultural yields, drinking water shortages, increased wildfire risk, loss of lives and economic damages.
- Drought and flood risks, and associated societal damages, are projected to further increase with every degree of global warming.
- Water-related disasters have dominated the list of disasters over the past 50 years and account for 70 per cent of all deaths related to natural disasters.
- Since 2000, flood-related disasters have risen by 134 per cent compared with the two previous decades. Most of the flood-related deaths and economic losses were recorded in Asia. The number and duration of droughts also increased by 29 per cent over this same period. Most drought-related deaths occurred in Africa.
Water solutions
- Healthy aquatic ecosystems and improved water management can lower greenhouse gas emissions and provide protection against climate hazards.
- Wetlands such as mangroves, seagrasses, marshes and swamps are highly effective carbon sinks that absorb and store CO2, helping to reduce greenhouse gas emissions.
- Wetlands also serve as a buffer against extreme weather events. They provide a natural shield against storm surges and absorb excess water and precipitation. Through the plants and microorganisms that they house, wetlands also provide water storage and purification.
- Early warning systems for floods, droughts and other water-related hazards provide a more than tenfold return on investment and can significantly reduce disaster risk: a 24-hour warning of a coming storm can cut the ensuing damage by 30 per cent.
- Water supply and sanitation systems that can withstand climate change could save the lives of more than 360,000 infants every year.
- Climate-smart agriculture using drip irrigation and other means of using water more efficiently can help reduce demand on freshwater supplies.
CLICK HERE FOR MORE INFORMATION
https://www.un.org/en/climatechange/science/climate-issues/water?