Chesapeake Bay pollution down, but water quality still short of goals, CBF says
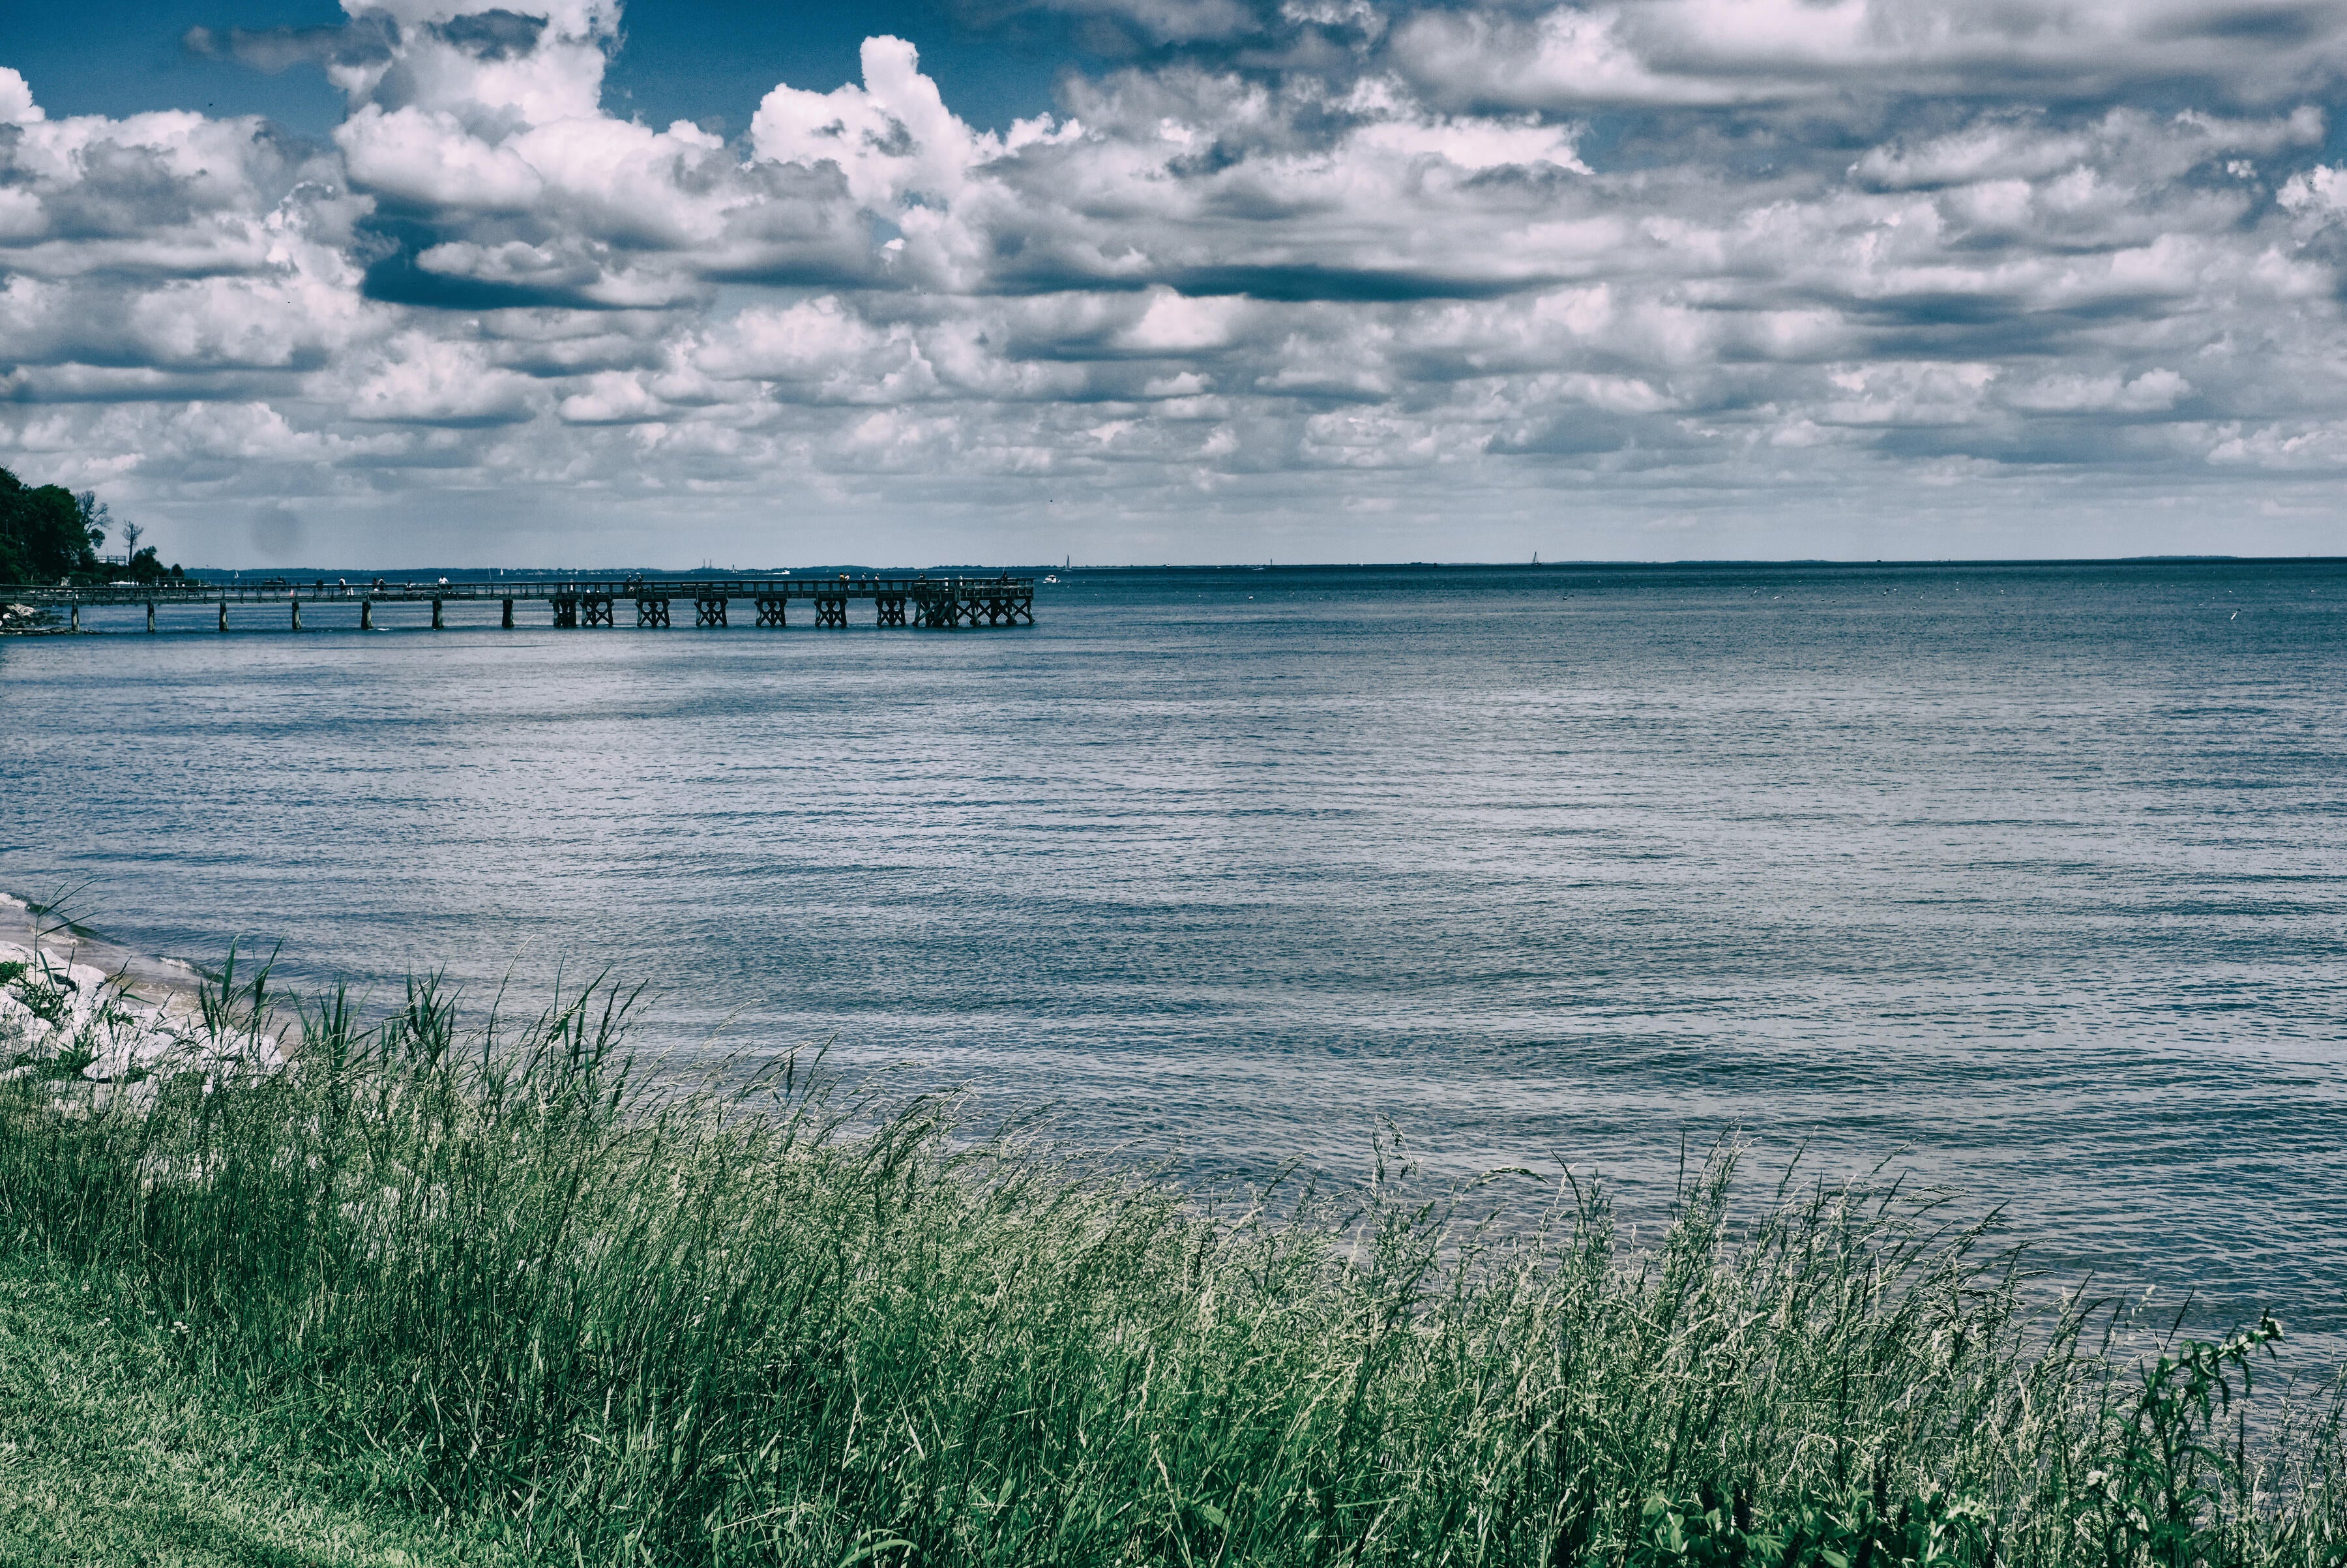
Pollution entering the Chesapeake Bay has dropped, but water quality remains below restoration targets, according to the Chesapeake Bay Foundation.
In 2023 nitrogen, phosphorus and sediment levels were significantly lower than the previous year, according to the CBF. Nitrogen fell 21.7%, phosphorus 26% and sediment 15.5%. These three pollutants are the leading contributors to the bay’s poor health.
The largest reductions came from the Pamunkey, Patuxent, Potomac and Susquehanna rivers. By contrast, nitrogen rose in the Appomattox, Mattaponi and Rappahannock rivers, where excess levels can trigger algae blooms that sap oxygen and threaten fish and crabs.
How pollution progress is measured
Researchers measure progress through the Bay TMDL Indicator, which uses modeled data to track how far pollution reductions move the bay toward a healthier ecosystem. To meet water quality goals, nitrogen must be cut by about 145 million pounds per year and phosphorus by about 9 million pounds.
Since 2009, projects such as tree planting, wastewater treatment upgrades and improved farming practices have reduced roughly 82 million pounds of nitrogen and 1.6 million pounds of phosphorus.
Those efforts are expected to cut an additional 27 million pounds of nitrogen and 4 million pounds of phosphorus annually in the years ahead, according to the CBF.
Despite these reductions, the University of Maryland Center for Environmental Science gave the bay a “C” in its 2024 annual report, down from a C+ the previous year.
The Maryland Department of Natural Resources also reported last month that underwater grasses in the state’s portion of the bay declined slightly in 2024. Both measures are considered key indicators of water quality.
Restoration efforts underway
Maryland continues to invest in bay improvements. In December, nearly $400,000 in federal grants went to five Maryland-based projects focused on environmental, cultural and historical conservation in the watershed.
Oyster restoration is also progressing. Oysters filter up to 50 gallons of water per day and provide habitat for small fish, worms and other prey species.
The Chesapeake Bay Program said in July it is on track to meet its 2025 goal of restoring oyster reefs in 10 tributaries, as set by the 2014 Chesapeake Bay Watershed Agreement.
Maryland’s restoration work includes Harris Creek, the Little Choptank, Tred Avon, Upper St. Mary’s and Manokin rivers. Virginia has completed restorations in its five tributaries and an additional site, while Maryland is finishing work in the Manokin.
Why thousands of people in rural West Virginia lack reliable drinking water
By Tom Hanson
Rhodell, West Virginia — For as long as Roman Patsey of Raleigh County, West Virginia, remembers, the Appalachian Mountains have provided virtually everything he’s needed to survive, from his income as a coal miner, to his tap water.
“I don’t know if it’s safe or not to tell you the truth,” Patsey told CBS News of his tap water source. “But, you know, what are you going to do? You’ve got to drink water.”
He took CBS News to his only source of drinking water for nearly 50 years: an abandoned coal mine near his home. Like so many here, he dug his own trenches and laid his own water lines hundreds of feet up a mountainside.
He says no part of him wondered why access to water should be this difficult.
“No, I just accepted it,” Patsey said. “It was something you had to do. I worried about running out of water, really, for years.”
He said he has never conducted regular tests on the water for possible contaminants
About 250,000 West Virginia residentsrely on untreated sources of water, like natural springs or aquifers from coal mines, according to the Environmental Protection Agency. The median income in this area is around $30,000 per year, according to U.S. Census data, a far cry from the prosperity that the coal industry once created. Coal companies used to fund and operate many town water systems in rural West Virginia. But when the industry declined, so did the water infrastructure it used to maintain. Patsey wanted to see this firsthand. So he, with a CBS News crew in tow, went to a water treatment plant in nearby Kimball, a town of more than 300 people in McDowell County. The plant’s windows are boarded up, the roof is completely missing, and there is rusted metal. Yet, this facility is supposed to clean tap water for the entire community.
Just 20 minutes up the road in Rhodell, a community in Raleigh County, the water treatment plant is also crumbling, with rust covering the pipes and a ceiling that is caved in.
“It’s in pretty bad shape as you can see,” said Shane Bragg with the Raleigh County Public Service District. “The fear is what you can’t see underground and what’s in the mines. We have no way of accessing the pumps in the mines, so when they go, the town will lose water.”
Raleigh County is racing to replace water systems before that happens with help from the nonprofit DigDeep, which works to bring clean tap water to the more than 2.2 million Americans who it says are living without it.
“We’re dealing with a lot of systems that are very expensive to maintain,” said Travis Foreman, director of DigDeep’s Appalachia Water Project. “And the local public service districts, they don’t have the manpower to keep up.”
In Rhodell, DigDeep is bringing clean water to the community for the first time in 10 years. “It is a human right to have access to water,” Foreman said. “…Everyone deserves to have that access.”
For Patsey, it’s a source of hope straight from the tap.
“Not long ago at 4 o’clock in the morning, I turned this on like this, not a drop,” Patsey said while standing at his kitchen sink. “It’s such a peace knowing I’m going to have water here.”
People participate in a protest called by Indigenous, rural and urban groups against the Dundee Precious Metals’ Loma Larga mining project and to demand the protection of local waters, in Cuenca, Ecuador, September 16, 2025. REUTERS/Maria Fernanda Garcia
(This Sept. 16 story has been corrected to fix Dundee Precious Metals’ stock market code and the company name throughout)
QUITO (Reuters) – Tens of thousands of residents and local leaders in Ecuador’s central Azuay province took to the streets on Tuesday to demand the suspension of a mining project by Canada’s Dundee Precious Metals, which they say will affect a vital water reserve.
The government of President Daniel Noboa had granted Dundee an environmental license to start building the Loma Larga gold mine there, but as community pressure mounted, the country’s energy minister in August suspended the start of construction work until Dundee Precious Metals, which recently changed its name to DPM Metals, provides an environmental management plan.
Provincial authorities reject the project, saying it will affect the region’s 3,200-hectare Quimsacocha reserve and its surrounding paramos – highland moors that act as giant sponges and supply the bulk of drinking water to major cities there.
Authorities estimated that over 90,000 people marched in the provincial capital of Cuenca on Tuesday, chanting “Hands off Quimsacocha!” and “Water is worth more than anything!”
“We want the national government to revoke the environmental license,” Cuenca Mayor Cristian Zamora said. “The streets of Cuenca are roaring … and they will have to listen to us.”
DPM declined to comment on the protesters’ demands.
Despite Ecuador’s significant gold and copper reserves, just two mines are operating in the country – projects owned by Canada’s Lundin Gold and EcuaCorriente, which is held by a Chinese mining consortium.
Noboa, meanwhile, stepped back from the project, saying responsibility for what happens next lies with the local authorities.
“The municipality and prefecture must take responsibility,” he said in a radio interview on Friday, saying if DPM takes them to an arbitration court that would have to go.
“There is a very high probability (the project will not go ahead), but there is also a probability that there will be problems in the future.”
Strong community opposition, environmental concerns and legal uncertainty in Ecuador have contributed to a relative lack of mining projects.
In Azuay, residents have rejected mining projects at the ballot box and courts have ruled in their favor to block mining projects in the area.
(Reporting by Alexandra Valencia; Writing by Sarah Morland; Editing by Richard Chang)
Ice doesn’t just freeze, it fuels hidden chemistry that could turn rivers rusty as the planet warms.
Source:Umea University
Summary:Researchers found that ice can trigger stronger chemical reactions than liquid water, dissolving iron minerals in extreme cold. Freeze-thaw cycles amplify the effect, releasing iron into rivers and soils. With climate change accelerating these cycles, Arctic waterways may face major transformations.
FULL STORY
An aerial view of the rust-colored Kutuk River in Gates of the Arctic National Park in Alaska. Thawing permafrost is exposing minerals to weathering, increasing the acidity of the water, which releases metals like iron, zinc, and copper. Credit: Ken Hill / National Park Service
Ice can dissolve iron minerals more effectively than liquid water, according to a new study from Umeå University. The discovery could help explain why many Arctic rivers are now turning rusty orange as permafrost thaws in a warming climate.
The study, recently published in the scientific journal PNAS, shows that ice at minus ten degrees Celsius releases more iron from common minerals than liquid water at four degrees Celsius. This challenges the long-held belief that frozen environments slow down chemical reactions.
“It may sound counterintuitive, but ice is not a passive frozen block,” says Jean-François Boily, Professor at Umeå University and co-author of the study. “Freezing creates microscopic pockets of liquid water between ice crystals. These act like chemical reactors, where compounds become concentrated and extremely acidic. This means they can react with iron minerals even at temperatures as low as minus 30 degrees Celsius.”
To understand the process, the researchers studied goethite – a widespread iron oxide mineral – together with a naturally occurring organic acid, using advanced microscopy and experiments.
They discovered that repeated freeze-thaw cycles make iron dissolve more efficiently. As the ice freezes and thaws, organic compounds that were previously trapped in the ice are released, fuelling further chemical reactions. Salinity also plays a crucial role: fresh and brackish water increase dissolution, while seawater can suppress it.
The findings apply mainly to acidic environments, such as mine drainage sites, frozen dust in the atmosphere, acid sulfate soils along the Baltic Sea coast, or in any acidic frozen environment where iron minerals interact with organics. The next step is to find out if the same is true for all iron-bearing ice. This is what ongoing research in the Boily laboratory will soon reveal.
“As the climate warms, freeze-thaw cycles become more frequent,” says Angelo Pio Sebaaly, doctoral student and first author of the study. “Each cycle releases iron from soils and permafrost into the water. This can affect water quality and aquatic ecosystems across vast areas.”
The findings show that ice is not a passive storage medium, but an active player. As freezing and thawing increase in polar and mountain regions, for the impact on ecosystems. and the natural cycling of elements could be significant.
Summary:A global research effort offers the first worldwide view of how climate change could affect water availability and drought severity in the decades to come. By the late 21st century, global land area and population facing extreme droughts could more than double — increasing from 3% during 1976-2005 to 7%-8%, according to a professor of civil and environmental engineering.Share:
FULL STORY
Michigan State University is leading a global research effort to offer the first worldwide view of how climate change could affect water availability and drought severity in the decades to come.
By the late 21st century, global land area and population facing extreme droughts could more than double — increasing from 3% during 1976-2005 to 7%-8%, according to Yadu Pokhrel, associate professor of civil and environmental engineering in MSU’s College of Engineering, and lead author of the research published in Nature Climate Change.
“More and more people will suffer from extreme droughts if a medium-to-high level of global warming continues and water management is maintained at its present state,” Pokhrel said. “Areas of the Southern Hemisphere, where water scarcity is already a problem, will be disproportionately affected. We predict this increase in water scarcity will affect food security and escalate human migration and conflict.”
The research team, including MSU postdoctoral researcher Farshid Felfelani, and more than 20 contributing authors from Europe, China and Japan are projecting a large reduction in natural land water storage in two-thirds of the world, also caused by climate change.
Land water storage, technically known as terrestrial water storage, or TWS, is the accumulation of water in snow and ice, rivers, lakes and reservoirs, wetlands, soil and groundwater — all critical components of the world’s water and energy supply. TWS modulates the flow of water within the hydrological cycle and determines water availability as well as drought.
“Our findings are a concern,” Pokhrel said. “To date, no study has examined how climate change would impact land water storage globally. Our study presents the first, comprehensive picture of how global warming and socioeconomic changes will affect land water storage and what that will mean for droughts until the end of the century.”
Felfelani said the study has given the international team an important prediction opportunity.
“Recent advances in process-based hydrological modeling, combined with future projections from global climate models under wide-ranging scenarios of socioeconomic change, provided a unique foundation for comprehensive analysis of future water availability and droughts,” Felfelani said. “We have high confidence in our results because we use dozens of models and they agree on the projected changes.”
The research is based on a set of 27 global climate-hydrological model simulations spanning 125 years and was conducted under a global modeling project called the Inter-Sectoral Impact Model Intercomparison Project. Pokhrel is a working member of the project.
“Our findings highlight why we need climate change mitigation to avoid the adverse impacts on global water supplies and increased droughts we know about now,” Pokhrel said. “We need to commit to improved water resource management and adaptation to avoid potentially catastrophic socio-economic consequences of water shortages around the world.”
Melting glaciers are putting a hold on countries’ development
Source:Ohio State University
Summary:Climate change is putting an enormous strain on global water resources, and according to researchers, the Tibetan Plateau is suffering from a water imbalance so extreme that it could lead to an increase in international conflicts.Share:
FULL STORY
Climate change is putting an enormous strain on global water resources, and according to researchers, the Tibetan Plateau is suffering from a water imbalance so extreme that it could lead to an increase in international conflicts.
Nicknamed “The Third Pole,” the Tibetan Plateau and neighboring Himalayas is home to the largest global store of frozen water outside of the North and South Polar Regions. This region, also known as the Asian water tower (AWT), functions as a complex water distribution system which delivers life-giving liquid to multiple countries, including parts of China, India, Nepal, Pakistan, Afghanistan, Tajikistan and Kyrgyzstan.
Yet due to the rapid melting of snow and upstream glaciers, the area can’t sustainably support the continued growth of the developing nations that rely on it.
“Populations are growing so rapidly, and so is the water demand,” said Lonnie Thompson, distinguished university professor of earth sciences at The Ohio State University and senior research scientist at the Byrd Polar Research Center. “These problems can lead to increased risks of international and even intranational disputes, and in the past, they have.”
Thompson, who has studied climate change for nearly five decades, is intimately familiar with the precarious nature of the region’s hydrological situation. In 1984, Thompson became a member of the first Western team sent to investigate the glaciers in China and Tibet. Since then, he and a team of international colleagues have spent years investigating ice core-derived climate records and the area’s rapidly receding ice along with the impact it’s had on the local settlements that depend on the AWT for their freshwater needs.
The team’s latest paper, of which Thompson is a co-author, was published in the journal Nature Reviews Earth and Environment. Using temperature change data from 1980 to 2018 to track regional warming, their findings revealed that the AWT’s overall temperature has increased at about 0.42 degrees Celsius per decade, about twice the global average rate.
“This has huge implications for the glaciers, particularly those in the Himalayas,” Thompson said. “Overall, we’re losing water off the plateau, about 50% more water than we’re gaining.” This scarcity is causing an alarming water imbalance: Northern parts of Tibet often experience an overabundance of water resources as more precipitation occurs due to the strengthening westerlies, while southern river basins and water supplies shrink as drought and rising temperatures contribute to water loss downstream.
According to the study, because many vulnerable societies border these downstream basins, this worsening disparity could heighten conflicts or exacerbate already tense situations between countries that share these river basins, like the long-term irrigation and water struggles between India and Pakistan.
“The way that regional climate varies, there are winners and losers,” Thompson said. “But we have to learn to work together in order to ensure adequate and equitable water supplies throughout this region.” As local temperatures continue to rise and water resources become depleted, more people will end up facing ever diminishing water supplies, he said.
Still, overall increases in precipitation alone won’t meet the increased water demands of downstream regions and countries.
To combat this, the study recommends using more comprehensive water monitoring systems in data-scarce areas, noting that better atmospheric and hydrologic models are needed to help predict what’s happening to the region’s water supply. Lawmakers should then use those observations to help develop actionable policies for sustainable water management, Thompson said. If policymakers do decide to listen to the scientists’ counsel, these new policies could be used to develop adaptation measures for the AWT through collaboration between upstream and downstream countries.
After all, when things go awry in one area of the world, like the butterfly effect, they tend to have long-lasting effects on the rest of Earth’s population. “Climate change is a global process,” Thompson said. “It doesn’t matter what country or what part of the world you come from. Sooner or later, you’ll have a similar problem.”
Exposure to oil — and possibly the chemicals used to clean up oil spills — has made corals prone to breaking and showing signs of high stress, even today
Source:American Geophysical Union
Summary:Deep-water corals in the Gulf of Mexico are still struggling to recover from the devastating Deepwater Horizon oil spill in 2010, scientists report at the Ocean Science Meeting in New Orleans. Comparing images of more than 300 corals over 13 years — the longest time series of deep-sea corals to date — reveals that in some areas, coral health continues to decline to this day.Share:
FULL STORY
Deep-water corals in the Gulf of Mexico are still struggling to recover from the devastating Deepwater Horizon oil spill in 2010, scientists report at the Ocean Sciences Meeting in New Orleans. Comparing images of more than 300 corals over 13 years — the longest time series of deep-sea corals to date — reveals that in some areas, coral health continues to decline to this day.
The spill slathered hundreds of miles of shoreline in oil, and a slick the size of Virginia coated the ocean surface. Over 87 days, 134 million gallons of oil spilled directly from the wellhead at a depth of 1520 meters (nearly 5000 feet) into the Gulf. While the spill was most visible at the surface, negative ecological impacts extended hundreds of meters into the ocean.
In a presentation on Tuesday, 20 February, scientists will show that deep-water corals remain damaged long after the spill. Over 13 years, these coral communities have had limited recovery — some even continuing to decline.
“We always knew that deep-sea organisms take a long time to recover, but this study really shows it,” said Fanny Girard, a marine biologist and conservationist at the University of Hawai’i at Mānoa who led the work. “Although in some cases coral health appeared to have improved, it was shocking to see that the most heavily impacted individuals are still struggling, and even deteriorating, a decade later.”
The findings can help guide deep-water restoration efforts following oil spills.
Delicate and damaged
A few months after the Deepwater Horizon well was capped, an interdisciplinary team of researchers surveyed the ocean floor 6 to 22 kilometers (3.7 to 13.7 miles) from the wellhead to record the damage. About 7 miles away and at 1,370 meters (4,495 feet) depth, they found a dense forest of tree-like Paramuricea corals that looked sickly.
“These corals were covered in a brown material,” Girard said. Testing showed the sludge contained traces of a combination of oil and chemical dispersants. A few months later, the researchers found two additional coral sites at 1,580 meters and 1,875 meters (4921 and 6233 feet, respectively) deep that were similarly damaged.
Deep-sea corals are suspension feeders and may have ingested contaminated particles, leading to the observed health impacts, the researchers said. Direct exposure to toxic chemicals contained in the mixture of oil and chemicals may have also damaged coral tissue. However, to date, scientists still do not exactly know how the oil and dispersant affected these vulnerable organisms.
Every year from 2010 to 2017, scientists visited those three sites to monitor damages, measure growth rates and note any recovery of the corals, as part of a large initiative aiming to better understand ecosystem impacts and improve our ability to respond to future oil spills. They used a remotely operated vehicle to take high-resolution photographs of corals at all three impacted sites and two far-removed reference sites, tracking more than 300 corals overall.
The researchers visited these sites again in 2022 and 2023 as part of the Habitat Assessment and Evaluation project, one of the projects funded through the Natural Resource Damage Assessment settlement. The images allowed the team to measure changes to coral health over time, including noting any breaks along the delicate branches of the coral caused by exposure to oil pollution.
Still suffering after all these years
The scientists found that even by 2022, the affected corals continued to show signs of stress and damage from the oil spill. The brown coating they had first observed was long gone, but upon closer inspection, the corals were weak and prone to breaking. The scarred spots where branches fell off were leaking mucus, and some corals whose skeletons were exposed had been colonized by other, parasitic coral species.
“Not only were some of these corals not recovering, but some of them seemed to be getting worse,” Girard said. She added that if the impacts are too heavy, ecosystems can struggle to recover at all, especially given the onslaught of climate change-related stressors like ocean acidification. “It’s really important to prevent damage in the first place, and the way to do that is through protection measures.”
Girard notes that their work is being used to inform restoration strategies, including trying to grow deep-sea corals for coral propagation from transplants, deploying artificial anchoring sites for recolonization or protecting the deepwater communities and letting nature heal itself. In the coming years, the team will continue to monitor to corals, looking for signs that they’re getting better — or worse.
Summary:The Dead Sea isn’t just the saltiest body of water on Earth—it’s a living laboratory for the formation of giant underground salt deposits. Researchers are unraveling how evaporation, temperature shifts, and unusual mixing patterns lead to phenomena like “salt snow,” which falls in summer as well as winter. These processes mirror what happened millions of years ago in the Mediterranean, leaving behind thick salt layers still buried today.Share:
FULL STORY
The Dead Sea’s extreme salinity and shifting water layers produce salt giants and even summer “salt snow.” Studying these rare processes provides clues to ancient oceans and modern coastal stability. Credit: Shutterstock
The Dead Sea is a confluence of extraordinary conditions: the lowest point on the Earth’s surface, with one of the world’s highest salinities. The high concentration of salt gives it a correspondingly high density, and the water body’s status as the deepest hypersaline lake gives rise to interesting and often temperature-related phenomena below the water’s surface that researchers are still uncovering.
One of the most intriguing features of the Dead Sea continues to be revealed: salt giants, large-scale salt deposits.
“These large deposits in the Earth’s crust can be many, many kilometers horizontally, and they can be more than a kilometer thick in the vertical direction,” said UC Santa Barbara mechanical engineering professor Eckart Meiburg, lead author of a paper published in the Annual Review of Fluid Mechanics. “How were they generated? The Dead Sea is really the only place in the world where we can study the mechanism of these things today.”
Indeed, while there are other bodies of water in the world with massive salt formations, such as the Mediterranean and Red seas, only in the Dead Sea can one find them in the making, which allows researchers to tackle the physical processes behind their evolution, and in particular, the spatial and temporal variations in their thickness.
Evaporation, precipitation, saturation
In their paper, Meiburg and fellow author Nadav Lensky of the Geological Survey of Israel cover the fluid dynamical and associated sediment transport processes currently governing the Dead Sea. These processes are influenced by several factors, including the Dead Sea’s status as a saltwater terminal lake — a lake with no outflow — leaving evaporation as the primary way water leaves the lake, which has been shrinking for millennia and leaving salt deposits as it does so. More recently, damming of the Jordan River, which feeds into the lake, has accelerated lake level decline, estimated at roughly 1 meter (3 feet) per year.
Temperatures along the water column also play a role in the dynamics behind salt giants and other formations such as salt domes and chimneys. A once “meromictic” (stably stratified) lake — the Dead Sea was layered such that less dense warmer water at the surface overlaid a more saline, cooler layer at depth throughout the entire year.
“It used to be such that even in the winter when things cooled off, the top layer was still less dense than the bottom layer,” Meiburg explained. “And so as a result, there was a stratification in the salt.”
That changed in the early 1980s thanks to the partial diversion of the Jordan River, which resulted in evaporation outpacing the rate of freshwater inflow. At that time, the surface salinity reached the levels found at depth, enabling mixing between the two layers and transitioning the lake from meromictic to holomictic (a lake that experiences annual overturns in the water column). The Dead Sea continues to stratify, but only for eight of the warmer months of the year.
In 2019, Meiburg et al identified a rather unique process occurring in the lake during the summer: halite crystal precipitation or “snow” that was more typical in the cooler season. Halite (“rock salt”) precipitates when the concentration of salt exceeds the amount that the water can dissolve, hence the deeper, colder, denser conditions of the bottom layer are where it is most likely to happen, and in the cooler months. However, they observed that during the summer, while evaporation was increasing the salinity of the upper layer, salts were nonetheless continuing to dissolve in that layer due to its warmer temperature. This leads to a condition called “double diffusion” at the interface between the two layers, in which sections of the saltier warmer water of the top layer cool down and sink, while portions of the lower, cooler, relatively less dense water warm up and rise. As the upper, denser layer cools down, salts precipitate out, creating the “salt snow” effect.
The combination of evaporation, temperature fluctuations and density changes throughout the water column, in addition to other factors including internal currents and surface waves, conspire to create salt deposits of various shapes and sizes, assert the authors. In contrast to shallower hypersaline bodies in which precipitation and deposition occur during the dry season, in the Dead Sea, these processes were found to be most intense during the winter months. This year-round “snow” season at depth explains the emergence of the salt giants, found in other saline bodies such as the Mediterranean Sea, which once dried up during the Messinian Salinity Crisis, about 5.96 to 5.33 million years ago.
“There was always some inflow from the North Atlantic into the Mediterranean through the Strait of Gibraltar,” Meiburg said. “But when tectonic motion closed off the Strait of Gibraltar, there couldn’t be any water inflow from the North Atlantic.” The sea level dropped 3-5 km (2-3 miles) due to evaporation, creating the same conditions currently found in the Dead Sea and leaving behind the thickest of this salt crust that can still be found buried below the deep sections of the Mediterranean, he explained. “But then a few million years later the Strait of Gibraltar opened up again, and so you had inflow coming in from the North Atlantic and the Mediterranean filled up again.”
Meanwhile, salinity fluxes and the presence of springs on the sea floor contribute to the formation of other interesting salt structures, such as salt domes and salt chimneys, according to the researchers.
In addition to gaining a fundamental understanding of some of the idiosyncratic processes that can occur in evaporating, hypersaline lakes, research into the associated sediment transport processes occurring on the emerging beaches may also yield insight on the stability and erosion of arid coastlines under sea level change, as well as the potential for resource extraction, the authors state.
Warming soil unleashes metals deadly to fish and food chains.
Source:University of California – Riverside
Summary:Warming Arctic permafrost is unlocking toxic metals, turning Alaska’s once-clear rivers into orange, acid-laced streams. The shift, eerily similar to mine pollution but entirely natural, threatens fish, ecosystems, and communities that depend on them—with no way to stop the process once it starts.Share:
FULL STORY
The Salmon River in Alaska now runs a rusty orange thanks to metal contaminants unleashed by thawing permafrost. Credit: Taylor Rhoades
In Alaska’s Brooks Range, rivers once clear enough to drink now run orange and hazy with toxic metals. As warming thaws formerly frozen ground, it sets off a chemical chain reaction that is poisoning fish and wreaking havoc on ecosystems.
As the planet warms, a layer of permafrost — permanently frozen Arctic soil that locked away minerals for millennia — is beginning to thaw. Water and oxygen creep into the newly exposed soil, triggering the breakdown of sulfide-rich rocks, and creating sulfuric acid that leaches naturally occurring metals like iron, cadmium, and aluminum from rocks into the river.
Often times, geochemical reactions like these are triggered by mining operations. But that is not the case this time.
“This is what acid mine drainage looks like,” said Tim Lyons, a biogeochemist at the University of California, Riverside. “But here, there’s no mine. The permafrost is thawing and changing the chemistry of the landscape.”
A new paper detailing the severity of the contamination has been published in the Proceedings of the National Academy of Sciences. Though the study focuses on the Salmon River, researchers warn that similar transformations are already underway across dozens of other Arctic watersheds.
“I have worked and traveled in the Brooks Range since 1976, and the recent changes in landforms and water chemistry are truly astounding,” said David Cooper, Colorado State University research scientist and study co-author.
Ecologist Paddy Sullivan of the University of Alaska first noticed the dramatic changes in 2019 while conducting fieldwork on Arctic forests shifting northward — another consequence of climate change. A pilot flying Sullivan into the field warned him the Salmon River hadn’t cleared up after the snowmelt and looked “like sewage.” Alarmed by what he saw, Sullivan joined forces with Lyons, Roman Dial from Alaska Pacific University, and others to investigate the causes and ecological consequences.
Their analysis confirmed that thawing permafrost was unleashing geochemical reactions that oxidize sulfide-rich rocks like pyrite, generating acidity and mobilizing a wide suite of metals, including cadmium, which accumulates in fish organs and could affect animals like bears and birds that eat fish.
In small amounts, metals aren’t necessarily toxic. However, the study shows that levels of metals in the river’s waters exceed U.S. Environmental Protection Agency toxicity thresholds for aquatic life. In addition, the iron-clouded waters reduce the amount of light reaching the bottom of the river and smother insect larvae eaten by the salmon and other fish.
While current metal concentrations in edible fish tissue are not considered hazardous to humans, the changes to the rivers pose indirect but serious threats. Chum salmon, a key subsistence species for many Indigenous communities, might struggle to spawn in gravel beds choked with fine sediment. Other species, such as grayling and Dolly Varden, may also be affected.
“It’s not just a Salmon River story,” Lyons said. “This is happening across the Arctic. Wherever you have the right kind of rock and thawing permafrost, this process can start.”
Unlike mine sites, where acid drainage can be mitigated with buffers or containment systems, these remote watersheds might have hundreds of contamination sources and no such infrastructure. Once the chemical process begins, the only thing that can stop it is recovery of the permafrost.
“There’s no fixing this once it starts,” Lyons said. “It’s another irreversible shift driven by a warming planet.”
The study, funded by the National Science Foundation’s Rapid Response program, highlights the potential danger for other Arctic regions. The researchers would like to help communities and land managers anticipate future impacts and, when possible, prepare for them.
“There are few places left on Earth as untouched as these rivers,” Lyons said. “But even here, far from cities and highways, the fingerprint of global warming is unmistakable. No place is spared.”
Understanding risk below the current US EPA regulatory standard
Source:Columbia University's Mailman School of Public Health
Summary:Long-term exposure to arsenic in water may increase cardiovascular risk and especially heart disease risk even at exposure levels below the federal regulatory limit, according to new research. A study describes exposure-response relationships at concentrations below the current regulatory limit and substantiates that prolonged exposure to arsenic in water contributes to the development of ischemic heart disease.Share:
FULL STORY
Long-term exposure to arsenic in water may increase cardiovascular disease and especially heart disease risk even at exposure levels below the federal regulatory limit (10µg/L) according to a new study at Columbia University Mailman School of Public Health. This is the first study to describe exposure-response relationships at concentrations below the current regulatory limit and substantiates that prolonged exposure to arsenic in water contributes to the development of ischemic heart disease.
The researchers compared various time windows of exposure, finding that the previous decade of water arsenic exposure up to the time of a cardiovascular disease event contributed the greatest risk. The findings are published in the journal Environmental Health Perspectives.
“Our findings shed light on critical time windows of arsenic exposure that contribute to heart disease and inform the ongoing arsenic risk assessment by the EPA. It further reinforces the importance of considering non-cancer outcomes, and specifically cardiovascular disease, which is the number one cause of death in the U.S. and globally,” said Danielle Medgyesi, a doctoral Fellow in the Department of Environmental Health Sciences at Columbia Mailman School. “This study offers resounding proof of the need for regulatory standards in protecting health and provides evidence in support of reducing the current limit to further eliminate significant risk.”
According to the American Heart Association and other leading health agencies, there is substantial evidence that arsenic exposure increases the risk of cardiovascular disease. This includes evidence of risk at high arsenic levels (>100µg/L) in drinking water. The U.S. Environmental Protection Agency reduced the maximum contaminant level (MCL) for arsenic in community water supplies (CWS) from 50µg/L to 10µg/L beginning in 2006. Even so, drinking water remains an important source of arsenic exposure among CWS users. The natural occurrence of arsenic in groundwater is commonly observed in regions of New England, the upper Midwest, and the West, including California.
To evaluate the relationship between long-term arsenic exposure from CWS and cardiovascular disease, the researchers used statewide healthcare administrative and mortality records collected for the California Teachers Study cohort from enrollment through follow-up (1995-2018), identifying fatal and nonfatal cases of ischemic heart disease and cardiovascular disease. Working closely with collaborators at the California Office of Environmental Health Hazard Assessment (OEHHA), the team gathered water arsenic data from CWS for three decades (1990-2020).
The analysis included 98,250 participants, 6,119 ischemic heart disease cases and 9,936 CVD cases. Excluded were those 85 years of age or older and those with a history of cardiovascular disease at enrollment. Similar to the proportion of California’s population that relies on CWS (over 90 percent), most participants resided in areas served by a CWS (92 percent). Leveraging the extensive years of arsenic data available, the team compared time windows of relatively short-term (3-years) to long-term (10-years to cumulative) average arsenic exposure. The study found decade-long arsenic exposure up to the time of a cardiovascular disease event was associated with the greatest risk, consistent with a study in Chile finding peak mortality of acute myocardial infarction around a decade after a period of very high arsenic exposure. This provides new insights into relevant exposure windows that are critical to the development of ischemic heart disease.
Nearly half (48 percent) of participants were exposed to an average arsenic concentration below California’s non-cancer public health goal <1 µg/L. In comparison to this low-exposure group, those exposed to 1 to <5 µg/L had modestly higher risk of ischemic heart disease, with increases of 5 to 6 percent. Risk jumped to 20 percent among those in the exposure ranges of 5 to <10 µg/L (or one-half to below the current regulatory limit), and more than doubled to 42 percent for those exposed to levels at and above the current EPA limit ≥10µg/L. The relationship was consistently stronger for ischemic heart disease compared to cardiovascular disease, and no evidence of risk for stroke was found, largely consistent with previous research and the conclusions of the current EPA risk assessment.
These results highlight the serious health consequences not only when community water systems do not meet the current EPA standard but also at levels below the current standard. The study found a substantial 20 percent risk at arsenic exposures ranging from 5 to <10 µg/L which affected about 3.2 percent of participants, suggesting that stronger regulations would provide significant benefits to the population. In line with prior research, the study also found higher arsenic concentrations, including concentrations above the current standard, disproportionally affect Hispanic and Latina populations and residents of lower socioeconomic status neighborhoods.
“Our results are novel and encourage a renewed discussion of current policy and regulatory standards,” said Columbia Mailman’s Tiffany Sanchez, senior author. “However, this also implies that much more research is needed to understand the risks associated with arsenic levels that CWS users currently experience. We believe that the data and methods developed in this study can be used to bolster and inform future studies and can be extended to evaluate other drinking water exposures and health outcomes.”
Co-authors are Komal Bangia, Office of Environmental Health Hazard Assessment, Oakland, California; James V. Lacey Jr and Emma S. Spielfogel,California Teacher Study, Beckman Research Institute, City of Hope, Duarte, California; and Jared A Fisher, Jessica M. Madrigal, Rena R. Jones, and Mary H. Ward, Division of Cancer Epidemiology and Genetics, National Cancer Institute.
The study was supported by the National Cancer Institute, grants U01-CA199277, P30-CA033572, P30-CA023100, UM1-CA164917, and R01-CA077398; and also funded by the Superfund Hazardous Substance Research and Training Program P42ES033719; NIH National Institute of Environmental Health Sciences P30 Center for Environmental Health and Justice P30ES9089, NIH Kirschstein National Research Service Award Institutional Research Training grant T32ES007322, NIH Predoctoral Individual Fellowship F31ES035306, and the Intramural Research Program of the NCI Z-CP010125-28.