Shedd Aquarium study on fish reproduction in Chicago River indicates continuing recovery from pollution
By Adam Harrington
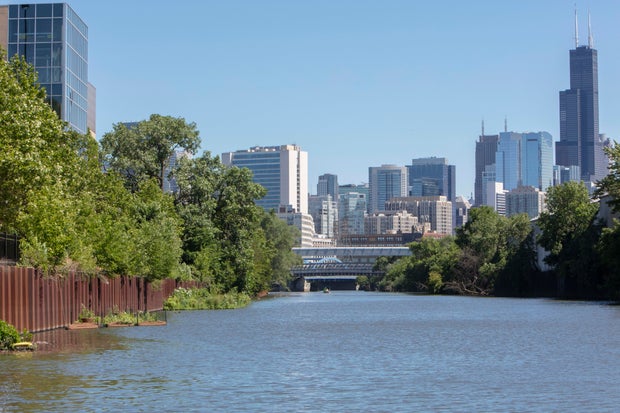
A new study by the Shedd Aquarium has found that the Chicago River system continues to recover from pollution, as evidenced by the fish species that have been spawning in the river system.
A report on the study, “Larval fish community of the urbanized Chicago River,” was published Wednesday. It was authored by Dr. Austin Happel, a research biologist at the Shedd Aquarium who focuses on freshwater ecosystems.
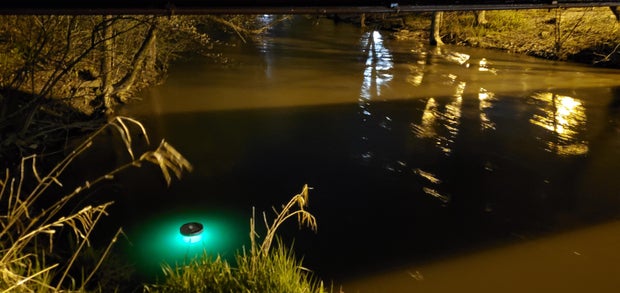
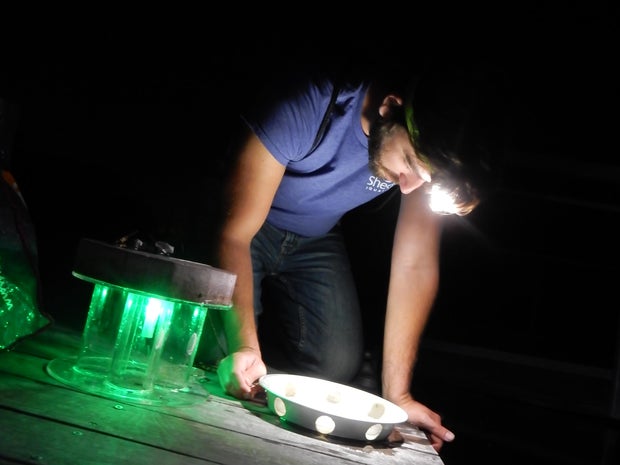
The study analyzed the species of fish that spawn in the Chicago River to sustain resilient and biodiverse fish communities, the Shedd explained in a news release. Using light traps at 10 locations in the river between 2020 and 2022, researchers collected 2,211 larval fish — and their DNA found the fish belonged to 24 different species.
“This research represents the first documentation of larvae from fish species occurring within the Chicago River, indicating that recovery and restoration efforts allow at least 24 species to successfully spawn and reach the larval stage,” Happel said in the news release. “Our previous studies showed that improvements to water quality in the river increased biodiversity, and now we have more positive news as populations are proliferating locally within the river.”
The Chicago River: A history of pollution
The reversal of the flow of the Chicago River is a point of Chicago pride that youngsters learn in history classes at local schools. On Jan. 2, 1900, the Sanitary District of Chicago — a predecessor to the Metropolitan Water Reclamation District — completed the massive undertaking by digging the 28-mile Sanitary and Ship Canal heading southwest out of the city.
Before the reversal, human and industrial waste would flow from the river right into Lake Michigan — the source of Chicago’s drinking water, then as now. The oft-repeated story that 90,000 people died of cholera and typhoid fever after a storm in Chicago sent sewage into the lake in 1885 has been debunked, but nevertheless, the flow of disgusting material from the river into the lake was a monumental public health hazard.
However, while the reversal of the flow of the river away from Lake Michigan protected the lake itself and the city’s drinking water, the Chicago River system remained polluted, neglected, and smelly as the city grew and developed.
As explained by Friends of the Chicago River, the city went on treating the river system like an alley — dumping trash and sewage and damaging conditions for people and wildlife alike.
“After more than 100 years of this abuse, the Chicago River and the others were so polluted that when the Clean Water Act passed in 1972, officials were convinced no one would ever want to fish or swim here — and set the standards incredibly low,” Friends of the Chicago River wrote.
But for half a century now, efforts have been under way to clean up the river. The Metropolitan Water Reclamation District of Greater Chicago set up the Deep Tunnel system to reduce flooding and improve waterway quality. Meanwhile, Friends of the Chicago River — founded in 1979 — undertook habitat restoration and long-range planning efforts for river improvement, with efforts ranging from planting wetlands vegetation to encouraging river-friendly land development.
Conditions on the Chicago River have improved to the point where a Chicago River Swim is set for this coming Saturday — the first such event in 95 years. The Shedd Aquarium study documents that the diversification of fish species in the river is also evidence that things are on the right track.
Signs of hope in the Chicago River fish community
The fish community in the Chicago River has been rising in both numbers and species diversity since the 1970s as conditions in the river have improved, the Shedd Aquarium study said.
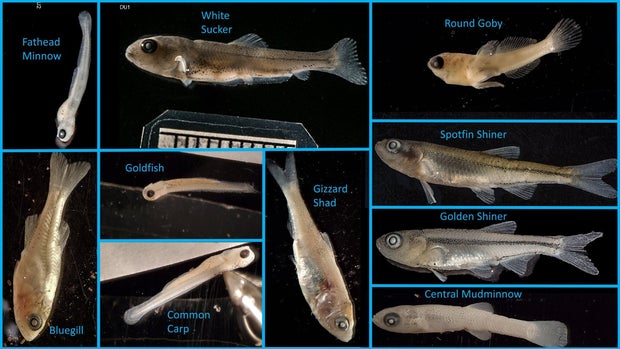
The study found species now reproducing in the Chicago River include popular sport fish like the black crappie, bluegill, and largemouth bass, and forage fish like the gizzard shad, golden shiner, and spotfin shiner. Larvae of brook silverside and mimic shiner were also found — which the Shedd found to be a pleasant surprise, as these fish were believed to be intolerant of pollution, the Shedd Aquarium said.
The peak abundance of fish larvae was found in July, as water temperatures reached the low 70s, the aquarium said.
The study also compared the fish larvae species found in the North Branch of the Chicago River versus the South Branch.
The North Branch of the River generally follows its historical path flowing southeast, though the North Shore Channel was dug between 1907 and 1910 to ensure further that sewage flowed into the river system and away from Lake Michigan. Before the flow reversal of 1900, the South Branch of the river flowed northeast into the Main Branch and on to Lake Michigan, but since the reversal, the South Branch has flowed southwest into the Sanitary and Ship Canal.
The Shedd Aquarium study found that species considered less tolerant of pollution were more common in the South Branch, while species more tolerant of pollution were seen more in the North Branch.
The finding indicates that “some combination of suitable substrate, submerged vegetation, and water quality and flow are most likely present in the South Branch.”
The study said these areas on the South Branch that may be favorable to the spawning of pollution-intolerant fish species could include backwater areas such as barge slips that are no longer used in Bubbly Creek. Bubbly Creek is the terminal South Fork of the river’s South Branch that was infamously once a dump site for animal remains from the Union Stockyards, but the study said the old barge slips may now be effective fish nursery habitats that offer both abundant food and protection from predators.
Happel is also researching how floating wetlands — which the Shedd Aquarium and the nonprofit Urban Rivers have been installing on the river system over the past several years — could also be affecting fish reproduction.
“As people continue to care about and conserve this critical freshwater ecosystem, we hope to see increases in the number of fish spawning in the system,” Happel said in the Shedd Aquarium news release.
The aquarium said the study could be taken as a sign of hope for other heavily modified urban waterways, and insights on how to support fish communities to spawn and grow.
The study also demonstrates how restoration can return wildlife to a waterway, the aquarium said, emphasizing that healthy fish populations mean healthier aquatic environments overall.
The study was published in the Journal of Great Lakes Research.
CLICK HERE FOR MORE INFORMATION