Microbes that breathe iron and eat sulfide could be quietly saving Earth’s oceans.
Source:University of Vienna
Summary:Researchers from the University of Vienna discovered MISO bacteria that use iron minerals to oxidize toxic sulfide, creating energy and producing sulfate. This biological process reshapes how scientists understand global sulfur and iron cycles. By outpacing chemical reactions, these microbes could help stop the spread of oceanic dead zones and maintain ecological balance.Share:
FULL STORY
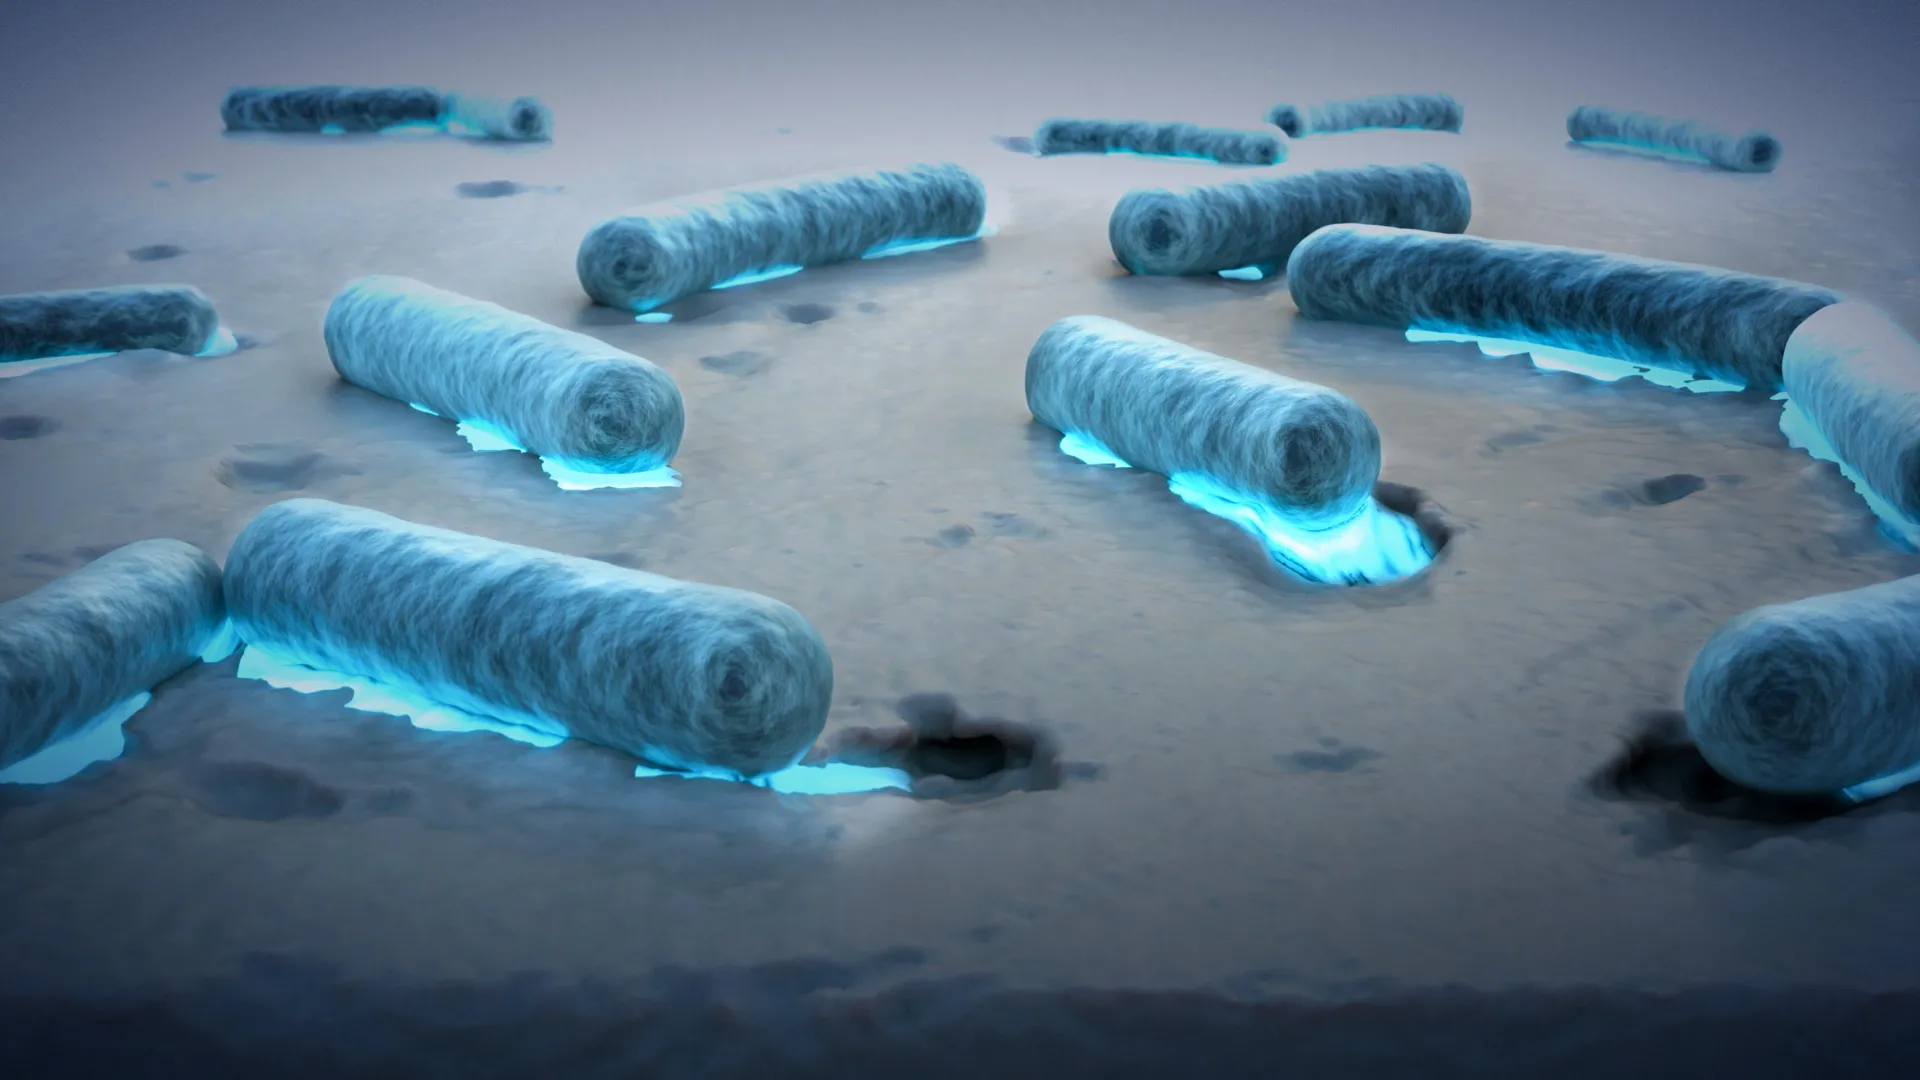
An international research team led by microbiologists Marc Mussmann and Alexander Loy at the University of Vienna has uncovered a completely new type of microbial metabolism. The newly identified microorganisms, known as MISO bacteria, are able to “breathe” iron minerals by oxidizing toxic sulfide. The scientists discovered that the reaction between hydrogen sulfide — a poisonous gas — and solid iron minerals is not only a chemical process, but also a biological one. In this newly revealed pathway, adaptable microbes living in marine sediments and wetland soils remove toxic sulfide and use it as an energy source for growth. These bacteria may also play an important role in preventing the expansion of oxygen-depleted “dead zones” in aquatic ecosystems.
The findings were recently published in Nature.
How Microbes Power Earth’s Element Cycles
The movement of key elements such as carbon, nitrogen, sulfur, and iron through the environment occurs through what are known as biogeochemical cycles. These transformations take place through reduction and oxidation (redox) reactions that move elements between air, water, soil, rocks, and living things. Because these cycles regulate greenhouse gases, they have a direct influence on Earth’s climate and temperature balance. Microorganisms drive nearly every step of these processes, using substances like sulfur and iron for respiration in much the same way humans rely on oxygen to metabolize food.
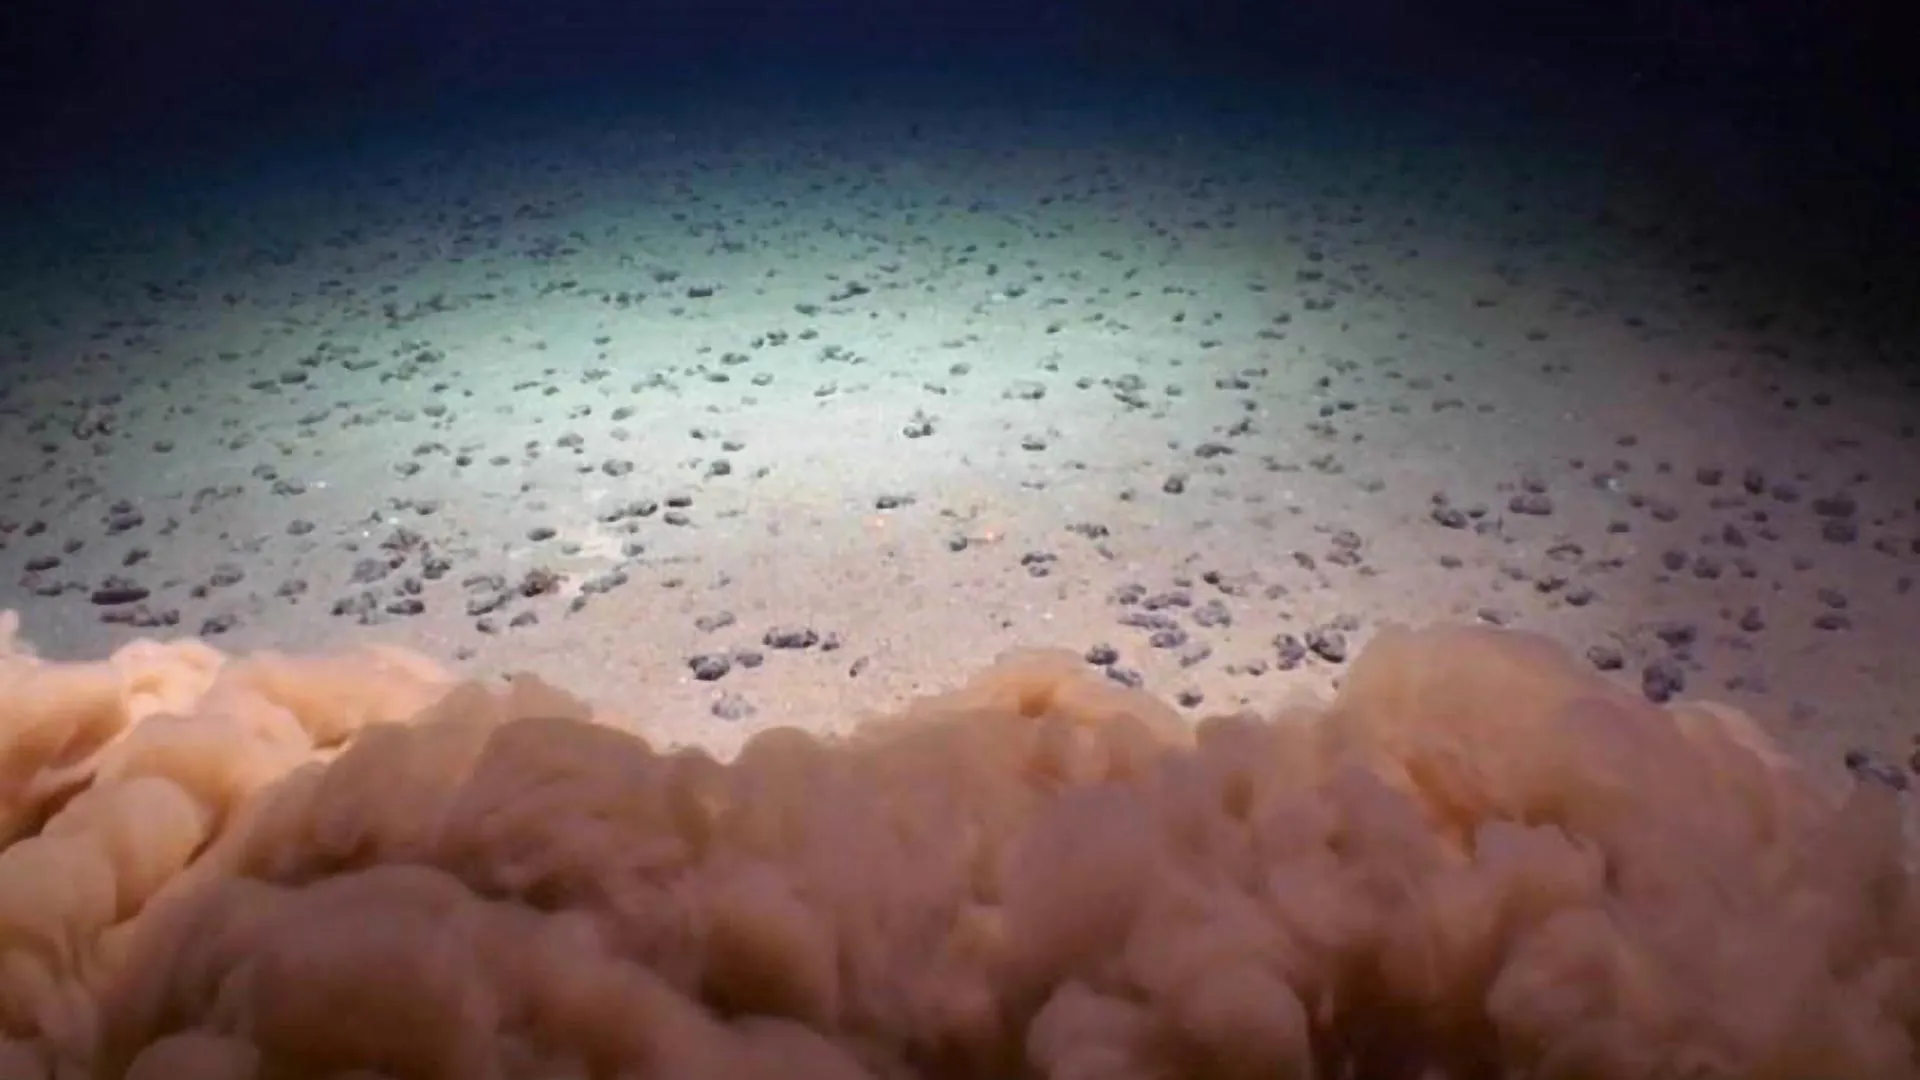
Sulfur and iron are particularly essential for microbial communities that live in oxygen-deprived habitats such as ocean floors, wetlands, and sediments. Sulfur can exist as a gas in the atmosphere, as sulfate dissolved in seawater, or locked within mineral deposits. Iron, on the other hand, shifts between different chemical forms depending on the availability of oxygen. When microbes process sulfur, they frequently change the form of iron at the same time, creating a tightly linked relationship between the two elements. This coupling affects nutrient cycling and influences the production or consumption of greenhouse gases like carbon dioxide and methane. Understanding these connections helps scientists predict how natural systems respond to environmental changes, including pollution and global warming.
Microbes That Use Iron to Eliminate Toxic Sulfide

“We show that this environmentally important redox reaction is not solely chemical,” says Alexander Loy, research group leader at CeMESS, the Centre for Microbiology and Environmental Systems Science at the University of Vienna. “Microorganisms can also harness it for growth.”
The team’s discovery reveals a new form of microbial energy production called MISO. This process connects the reduction of iron(III) oxide with the oxidation of sulfide. Unlike a purely chemical reaction, MISO directly generates sulfate, skipping intermediate steps in the sulfur cycle. “MISO bacteria remove toxic sulfide and may help prevent the expansion of so-called ‘dead zones’ in aquatic environments, while fixing carbon dioxide for growth — similar to plants,” adds Marc Mussmann, senior scientist at CeMESS.
A Fast, Widespread Process That Shapes the Planet
In laboratory experiments, the researchers found that the MISO reaction carried out by microbes happens faster than the same reaction when it occurs chemically. This indicates that microorganisms are likely the main force behind this transformation in natural environments. “Diverse bacteria and archaea possess the genetic capacity for MISO,” explains lead author Song-Can Chen, “and they are found in a wide range of natural and human-made environments.”
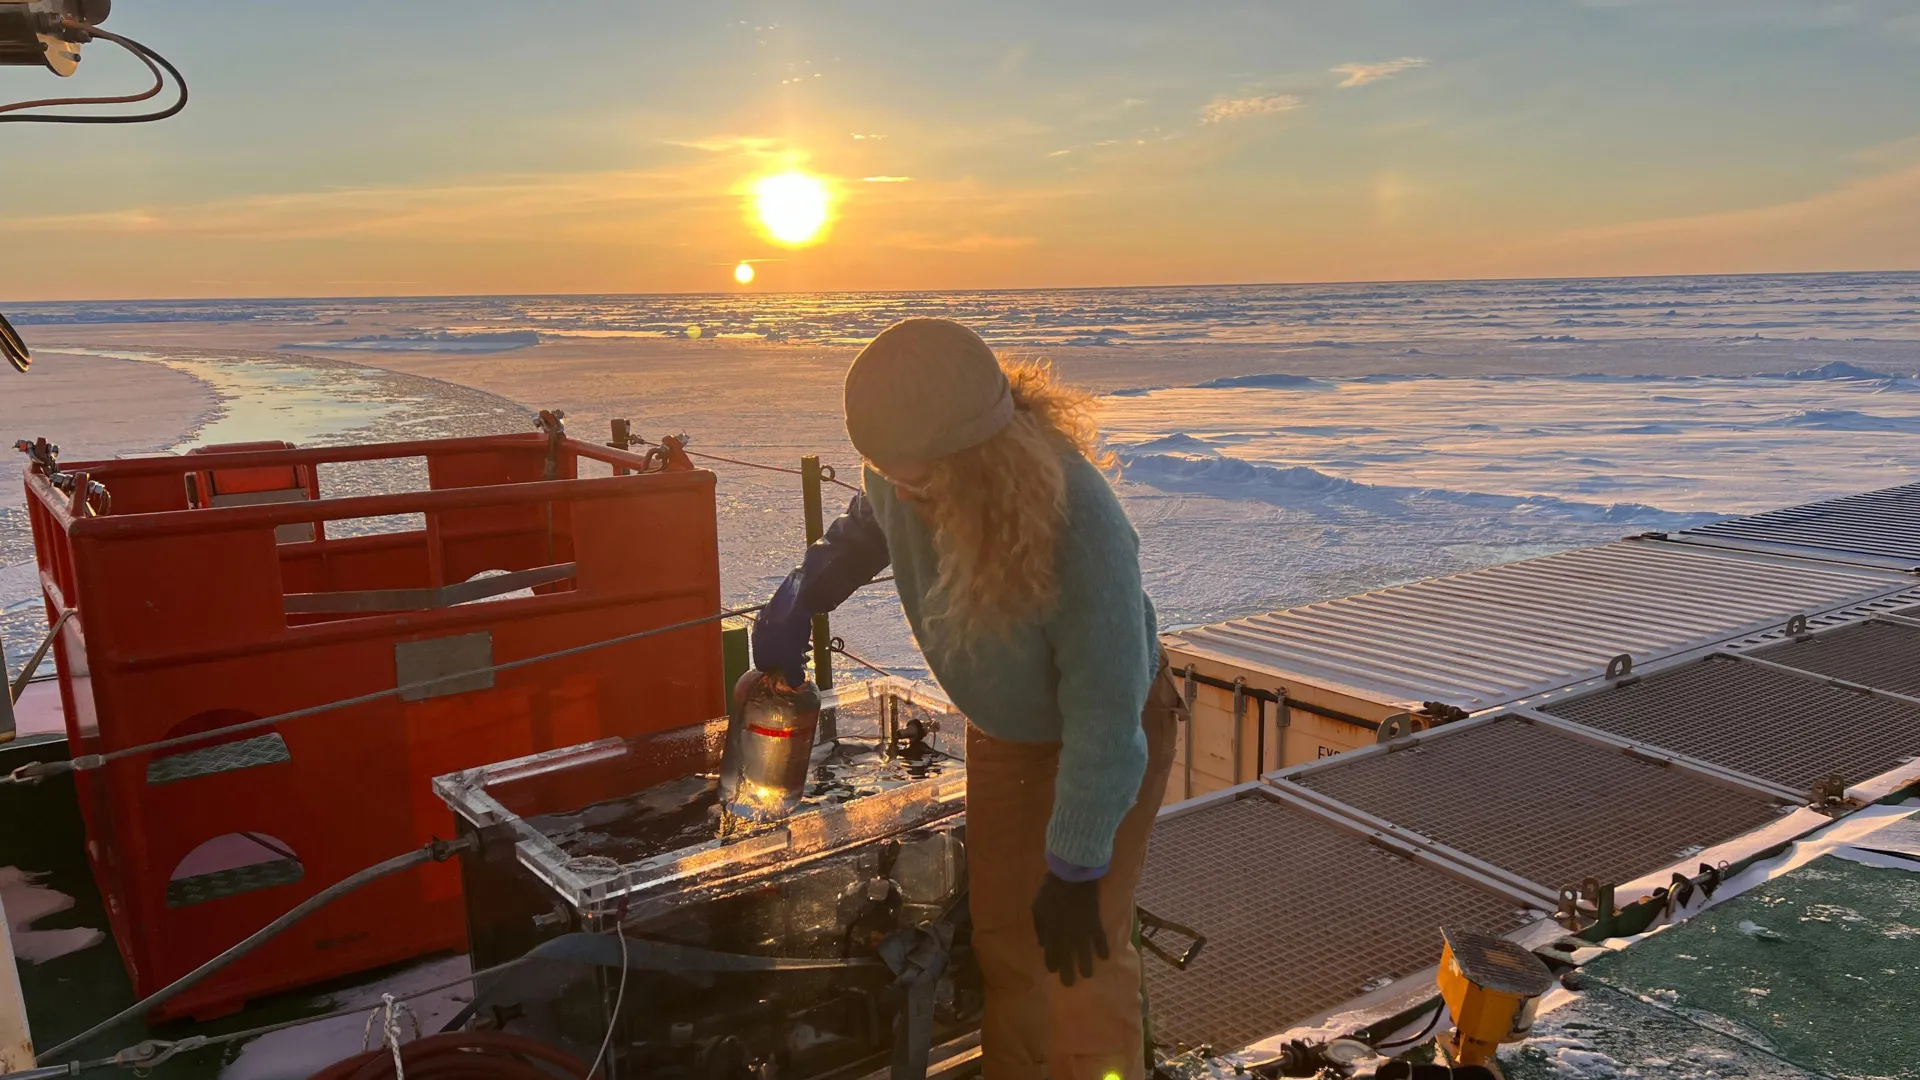
According to the study, MISO activity in marine sediments could be responsible for as much as 7% of all global sulfide oxidation to sulfate. This process is fueled by the steady flow of reactive iron entering the oceans from rivers and melting glaciers. The research, supported by the Austrian Science Fund (FWF) as part of the ‘Microbiomes Drive Planetary Health’ Cluster of Excellence, identifies a new biological mechanism linking the cycling of sulfur, iron, and carbon in oxygen-free environments.
“This discovery demonstrates the metabolic ingenuity of microorganisms and highlights their indispensable role in shaping Earth’s global element cycles,” concludes Alexander Loy.
CLICK HERE FOR MORE INFORMATION
https://www.sciencedaily.com/releases/2025/11/251109013252.htm