Each year, Sacramento needs about a million more gallons of water per day to meet growing demand. Soon, the city’s water treatment plants will have a tough time keeping up.
A new multi-million dollar plan aims to modernize the system, ensuring Sacramento’s future is flush with water.
“It’s not something everyone gets excited about but it’s really, really important,” said.
The city unveiled a plan called Water+. It will double the daily capacity of the existing Sacramento River water treatment plant, just off Interstate 5 and Richards Boulevard.
“It’s improving our water system to be more resilient and more able to adapt to some of the modern challenges that we experience,” said. Continue watchingMiwok tribe purchases former Macy’s building in downtown Sacramentoafter the ad
The plant dates back to 1921 and some of the aging infrastructure needs to be replaced.
The city said that modernizing the facility will help comply with environmental regulations and provide reliable water that filters out more river contaminants.
“We’ve got things like cyano algae toxic blooms that kind of pop up from time to time that can affect our ability to manage drinking water,” said.
But there’s no way for the current plant to expand its property size, so said “we need to be able to figure out how we can most efficiently use the space that we do have.”
That means some of the historical landmark buildings will be impacted. The plan also calls for adding an additional water intake pumping station on the Sacramento River just upstream from the existing one near Matsui Park.
That will help provide more water for future city growth.
“This project is being phased out over long term so that we can be able to address the water needs of that growth,” said.
So far, there’s no estimate on how much the project will cost. The city’s utility department is expected to release an environmental impact report this spring.
Beachgoers in Los Angeles County are being urged to avoid any contact with the water, particularly near storm drains, creeks, and rivers.
The Ocean Quality Rain Advisory is expected to remain in place for all county beaches until 8 a.m. Thursday.
“Ocean and bay recreational waters, especially near discharging storm drains, creeks and rivers can be contaminated with bacteria, chemicals, debris, trash, and other public health hazards from city streets and mountain areas after a rain fall,” the advisory warned.
Public health officials caution that anyone who enters the water in these areas could risk illness, and the advisory may be extended if rainfall continues.
The Michigan Department of Environment, Great Lakes and Energy has issued a report that there are “significant deficiencies” in the management of Wyandotte’s water system.
But the city says the water is safe, adding “it consistently meets or exceeds all state and federal water quality standards.”
“There is no known current risk to public health from the City’s drinking water, and we are fully committed to maintaining that record,” the city said on its website.
The respective statements spin out of a notice that Michigan EGLE issued April 30, citing “significant deficiencies” in the areas of treatment, distribution system, finished water storage and management/operations. The letter was also sent to the Wayne County Health Department.
“The most significant observations during the Survey are the need for adequate investment in capital improvement projects, completion of maintenance activities, and adequate investment in staffing,” EGLE said in its letter. “There are several indications the City is not keeping up with capital investments, especially in the distribution system and future operational and maintenance needs may overwhelm the available budget and resources.”
The four matters listed as significant deficiencies were:
Failure to keep up with an inspection schedule for backflow prevention and cross-connections.
Damage to the vents at one reservoir.
Assorted debris, such as tennis balls and beverage containers, was found at another reservoir.
A water treatment process that didn’t include a specified method of mixing the treatment chemical into the raw water.
The city was given 120 days to either correct the significant deficiencies noted or submit a “corrective action plan” that EGLE will review.
There were also other matters noted as deficiencies, such as an inspection report that showed zebra mussels found near an entrance to a water intake pipe, and routine maintenance schedules, such as hydrant flushing that was not implemented “due to inadequate staffing.”
In addition, the city of Wyandotte has not included fluoride treatment for several years. “If fluoride treatment is not continued, the appropriate local procedures need to be followed,” the letter says. “It is imperative for the water supply to notify the public so residents can make informed decisions about their oral health.”
On that detail, the city has replied, “Fluoridation of drinking water is not required by law. The City discontinued fluoride treatment in 2015 during a treatment plant rehabilitation project. Fluoride levels are monitored and disclosed in the City’s annual Consumer Confidence Reports, and residents are encouraged to consult with their dental professionals about supplemental fluoride needs.”
Wyandotte officials say after the April report was issued, the city’s Municipal Services took steps toward “actively addressing all recommendations.” This includes a series of repairs at the reservoirs and evaluation of its filtration method.
In the meantime, the EGLE staff noted that during the three years before its report was issued, the city had taken a number of steps to address water facility operations and improvements.
Researchers from the University of Copenhagen have gained unique insight into the mechanisms behind the collapse of Antarctic ice shelves, which are crucial for sea level rise in the Northern Hemisphere. The discovery of old aerial photos has provided an unparalleled dataset that can improve predictions of sea level rise and how we should prioritise coastal protection and other forms of climate adaptation.
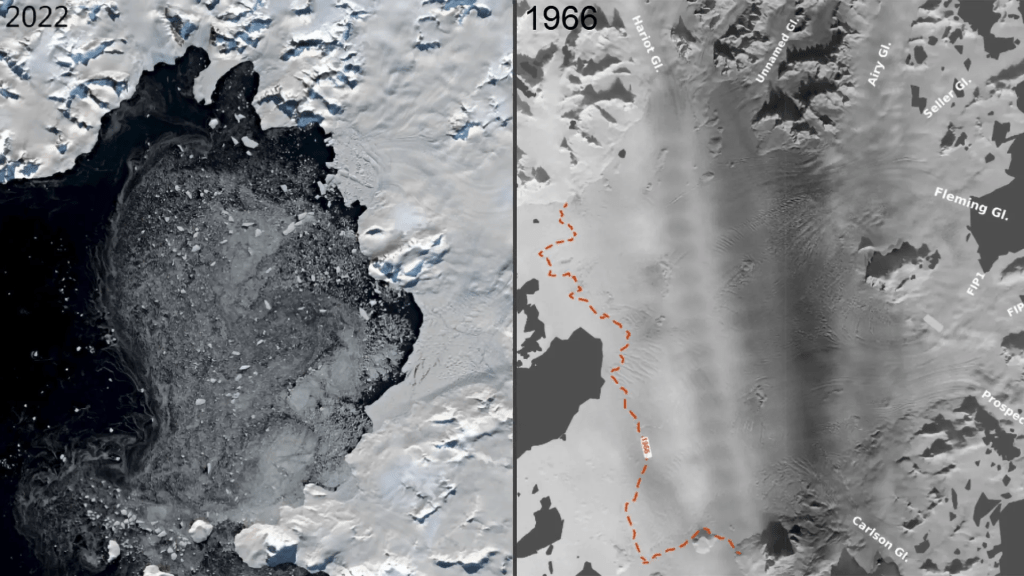
On November 28, 1966, an American aeroplane flies over the Antarctic Peninsula just south of the southernmost tip of Chile.
On board is a photographer, probably from the US Navy, whose job is to map the Antarctic landscape. But it turns out that the photographer is also documenting a very special situation that is in progress. He shoots an aerial photo of the Wordie Ice Shelf, which, 30 years later, has almost vanished after a total collapse.
The consequence of this collapse was that the ‘plug’ that held large amounts of glacier ice broke off, leaving the ice sheet floating freely into the sea.
Fortunately, Wordie is a relatively small ice shelf and the sea level rise it has caused can be measured in millimeters. But there are much larger ice shelves in Antarctica, which, like Wordie, could collapse due to climate change. Just the two largest ice shelves, Ronne and Ross, are believed to hold enough ice to account for sea level rises of up to five meters.
If, in this context, we think that Antarctica is far away, we need to understand that the melting of ice in the Southern Hemisphere will cause sea levels to rise in places like Denmark in the Northern Hemisphere, due to the effects of gravity. A new research study provides insights that can help identify signs of incipient collapse in these ice shelves and assess the stage of collapse.
The photo of Wordie from 28 November 1966 — the first in a long series of images that continually document the collapse of the Wordie Ice Shelf through the 1960s — has become a valuable first data point in a study of the ice shelf collapse recently completed by researchers at the University of Copenhagen.
In their paper, now published in Nature Communications, they present a unique dataset based on the vast archives of old aerial images combined with modern satellite observations, which, for the first time, shows the collapse of an ice shelf as a constant evolution in a long time series. A critical insight that can be used to improve scientists’ understanding of ice shelves and the mechanisms behind their collapse.
“We have identified several signs of incipient ice shelf collapse that we expect will be observed in other ice shelves, but perhaps more importantly, the dataset has given us a multitude of pinning points that can reveal how far advanced a collapse is. It’s a completely new tool that we can use to do reality checks on ice shelves that are at risk of collapsing or already in the process of collapsing,” says Postdoc Mads Dømgaard from the Department of Geosciences and Natural Resource Management, who is lead author of the study.
According to the researchers, this knowledge will enhance computer models of sea level rise and lead to more accurate predictions of when the water will rise, allowing for prioritization of investments in climate change adaptation in the most effective way.
Warmer seawater and melting under the ice were most conclusive
The hundreds of historical aerial photos were analyzed using a technique known as structure-from-motion photogrammetry. The method has enabled scientists to accurately reconstruct ice thickness, as well as its extent, surface structure and flow velocity, dating back to the 1960s.
In this way, the researchers analyzed the collapse of Wordie and learned more about the factors involved. It was previously assumed that a warmer atmosphere was the primary factor leading to the collapse, and, similarly, that the formation of meltwater lakes on the ice surface had also played a part. The new study has disproved both assumptions.
Instead, the researchers highlight melting under the ice where the sea and ice meet as definitive factors.
“Our findings show that the primary driver of Wordie’s collapse is rising sea temperatures, which have generated the melting beneath the floating ice shelf,” Mads Dømgaard says.
Collapse is tougher than we thought – like it or not
Furthermore, the study’s findings have already altered the foundation of scientists’ knowledge about ice shelf collapse. According to co-author Anders Anker Bjørk, the new data advances our understanding of how and at what speed these collapses occur.
“The tentative conclusion from our findings is that ice shelf collapse may be slower than we thought. This means that the risk of a very rapid development of violent sea level rise from melting in Antarctica is slightly lower, based on knowledge from studies like this one,” says Anders Anker Bjørk, Assistant Professor at the Department of Geosciences and Natural Resource Management.
But there is also a flip side to this, he explains:
“It was already a supertanker that needed to be turned to stall the melting of ice in Antarctica, but our data shows a collapse process that is even more protracted than previously assumed. And this longer process will make it harder to reverse the trend once it has started. This is an unambiguous signal to prioritize halting greenhouse gas emissions now rather than sometime in the future,” Anders Anker Bjørk says.
Facts: ice shelves and sea level rise
Ice shelves, like Wordie, act as a kind of brake on glaciers flowing from the ice sheet towards the sea. When an ice shelf vanishes, the glaciers lose this support and can begin to float and melt more rapidly.
As the ice mass of ice shelves is already partially or wholly in the sea, their direct contribution to sea level rise is limited. On the other hand, the glacier ice they retain is on land and, therefore, every cubic meter affects the water level of the world’s oceans.
Although Antarctica is far away, areas like Denmark are being affected significantly by sea level rise caused by ice shelf collapses resulting from gravitational forces. Before Antarctica melts, its ice mass helps pull sea waters southwards. When the ice has melted into the sea, the gravitational field has changed, causing the oceans to the north to rise proportionally more.
Facts: How dusty old photos became important data
In the study, the researchers used images from multiple overflights of Wordie, shot between 1966 and 1969.
In analyzing the historical aerial photos, the researchers employed the structure-from-motion photogrammetry method, which utilizes overlapping photos to calculate accurate three-dimensional models of landscapes or objects.
By analyzing differences in perspective between the photos, it’s possible to measure heights and distances with high accuracy. This allows tracing how the ice surface, thickness and velocity have changed over time.
By analyzing ancient ocean seafloor sediments and running detailed climate simulations, the research team found no evidence for the presence of a thick ice shelf. Instead, this study paints a picture of an Arctic that, despite being cold and icy, still had open water areas that allowed for biological activity and ocean circulation. Credit: Morven Muilwijk
For years, scientists have debated whether a giant thick ice shelf once covered the entire Arctic Ocean during the coldest ice ages. Now a new study published in Science Advances, challenges this idea as the research team found no evidence for the presence of a massive ~1km ice shelf. Instead, the Arctic Ocean appears to have been covered by seasonal sea ice — leaving open water and life-sustaining conditions even during the harshest periods of cold periods during the last 750,000 years. This discovery gives insights crucial for our understanding of how the Arctic has responded to climate change in the past — and how it might behave in the future.
Tiny traces of life in ancient mud
Led by the European Research Council Synergy Grant project Into the Blue — i2B, the research team studied sediment cores collected from the seafloor of the central Nordic Seas and Yermak Plateau, north of Svalbard. These cores hold tiny chemical fingerprints from algae that lived in the ocean long ago. Some of these algae only grow in open water, while others thrive under seasonal sea ice that forms and melts each year.
“Our sediment cores show that marine life was active even during the coldest times,” said Jochen Knies, lead author of the study, based at UiT The Arctic University of Norway and co-lead of the Into The Blue — i2B project. “That tells us there must have been light and open water at the surface. You wouldn’t see that if the entire Arctic was locked under a kilometre-thick slab of ice.”
One of the key indicators the team looked for was a molecule called IP25, which is produced by algae that live in seasonal sea ice. Its regular appearance in the sediments shows that sea ice came and went with the seasons, rather than staying frozen solid all year round.
Simulating ancient Arctic climates
To test the findings based on the geological records, the research team used the AWI Earth System Model — a high-resolution computer model — to simulate Arctic conditions during two especially cold periods: the Last Glacial Maximum around 21,000 years ago, and a deeper freeze about 140,000 years ago when large ice sheets covered a lot of the Arctic.
“The models support what we found in the sediments,” said Knies. “Even during these extreme glaciations, warm Atlantic water still flowed into the Arctic gateway. This helped keep some parts of the ocean from freezing over completely.”
The models also showed that the ice wasn’t static. Instead, it shifted with the seasons, creating openings in the ice where light could reach the water — and where life could continue to thrive. This research not only reshapes our view of past Arctic climates but also has implications for future climate predictions. Understanding how sea ice and ocean circulation responded to past climate extremes can improve models that project future changes in a warming world.
“These reconstructions help us understand what’s possible — and what’s not — when it comes to ice cover and ocean dynamics,” said Gerrit Lohmann, co-author of this study, based at Alfred Wegener Institute, Helmholtz Centre for Polar and Marine Research (AWI) and co-lead of Into The Blue — i2B. “That matters when trying to anticipate how ice sheets and sea ice might behave in the future.”
Re-thinking the giant ice shelf theory
Some scientists have argued that features on the Arctic seafloor suggest that a huge, grounded ice shelf once covered the entire ocean. But this new study offers another explanation.
“There may have been short-lived ice shelves in some parts of the Arctic during especially severe cold phases,” said Knies. “But we don’t see any sign of a single, massive ice shelf that covered everything for thousands of years.”
One possible exception could have occurred about 650,000 years ago, when biological activity in the sediment record dropped sharply. But even then, the evidence points to a temporary event, not a long-lasting frozen lid over the Arctic.
Understanding the Arctic’s future
The study sheds new light on how the Arctic has behaved under extreme conditions in the past. This matters because the Arctic is changing rapidly today. Knowing how sea ice and ocean circulation responded to past climate shifts helps scientists understand what might lie ahead.
“These past patterns help us understand what’s possible in future scenarios,” said Knies. “We need to know how the Arctic behaves under stress — and what tipping points to watch for — as the Arctic responds to a warming world.”
The full paper, “Seasonal sea ice characterized the glacial Arctic-Atlantic gateway over the past 750,000 years,” is available in Science Advances.
This research is part of the European Research Council Synergy Grant project Into the Blue — i2B and the Research Council of Norway Centre of Excellence, iC3: Centre for ice, Cryosphere, Carbon, and Climate.
Scientists have discovered that melting glaciers could unleash powerful volcanic eruptions by removing the weight that keeps magma trapped deep underground. Antarctica may hold hundreds of these explosive time bombs. Credit: Shutterstock
Melting glaciers may be silently setting the stage for more explosive and frequent volcanic eruptions in the future, according to research on six volcanoes in the Chilean Andes.
Presented today (July 8) at the Goldschmidt Conference in Prague, the study suggests that hundreds of dormant subglacial volcanoes worldwide – particularly in Antarctica – could become more active as climate change accelerates glacier retreat.
The link between retreating glaciers and increased volcanic activity has been known in Iceland since the 1970s, but this is one of the first studies to explore the phenomenon in continental volcanic systems. The findings could help scientists better understand and predict volcanic activity in glacier-covered regions.
Researchers from the University of Wisconsin-Madison, USA, used argon dating and crystal analysis across six volcanoes in southern Chile, including the now dormant Mocho-Choshuenco volcano, to investigate how the Patagonian Ice Sheet’s advance and retreat influenced past volcanic behaviour. The work is in collaboration with researchers from Lehigh University, University of California Los Angeles, and Dickinson College.
By precisely dating previous eruptions and analysing crystals in erupted rocks, the team tracked how the weight and pressure of glacial ice alter the characteristics of magma underground.
They found that during the peak of the last ice age (around 26,000-18,000 years ago), thick ice cover suppressed the volume of eruptions and allowed a large reservoir of silica-rich magma to accumulate 10-15 km below the surface.
As the ice sheet melted rapidly at the end of the last ice age, the sudden loss of weight caused the crust to relax and gasses in the magma to expand. This buildup of pressure triggered explosive volcanic eruptions from the deep reservoir, causing the volcano to form.
Pablo Moreno-Yaeger from the University of Wisconsin-Madison, USA, is presenting the research at the Goldschmidt Conference. He said: “Glaciers tend to suppress the volume of eruptions from the volcanoes beneath them. But as glaciers retreat due to climate change, our findings suggest these volcanoes go on to erupt more frequently and more explosively. The key requirement for increased explosivity is initially having a very thick glacial coverage over a magma chamber, and the trigger point is when these glaciers start to retreat, releasing pressure – which is currently happening in places like Antarctica.
“Our study suggests this phenomenon isn’t limited to Iceland, where increased volcanicity has been observed, but could also occur in Antarctica. Other continental regions, like parts of North America, New Zealand and Russia, also now warrant closer scientific attention.”
While the volcanic response to glacial melting is almost instant in geological terms, the process of changes in the magma system is gradual and occurs over centuries, giving some time for monitoring and early warning.
The researchers also note that increased volcanic activity could have global climate impacts. In the short term, eruptions release aerosol (tiny particles in gases) that can temporarily cool the planet. This was seen after the 1991 eruption of Mount Pinatubo in the Philippines, which reduced global temperatures by approximately 0.5 degrees C. But with multiple eruptions, the effects reverse.
“Over time the cumulative effect of multiple eruptions can contribute to long-term global warming because of a buildup of greenhouse gases,” said Moreno-Yaeger. “This creates a positive feedback loop, where melting glaciers trigger eruptions, and the eruptions in turn could contribute to further warming and melting.”
The research was funded by the National Science Foundation as part of a grant led by Professor Brad Singer at UW-Madison, and is due to be published in a peer-reviewed journal later this year.
The Goldschmidt Conference is the world’s foremost geochemistry conference. It is a joint congress of the European Association of Geochemistry and the Geochemical Society (US), and over 4000 delegates attend. It takes place in Prague, Czech Republic, from July 6-11 2025.
In the days before Hurricane Milton hit Florida, forecasters worried it could send as much as 15 feet of water rushing onto the heavily populated shores of Tampa Bay
Debris along Commonwealth Drive clogs the roadway after Hurricane Milton made landfall nearby Thursday, Oct. 10, 2024 in Siesta Key, Fla. (Chris Urso/Tampa Bay Times via AP)
In the days before Hurricane Milton hit Florida, forecasters were worried it could send as much as 15 feet (4.5 meters) of water rushing onto the heavily populated shores of Tampa Bay.
Instead, several feet of water temporarily drained away.
Why? “Reverse storm surge” is a familiar, if sometimes unremarked-upon, function of how hurricane winds move seawater as the storms hit land — in fact, it has happened in Tampa Bay before.
In the Northern Hemisphere, tropical storm winds blow counterclockwise. At landfall, the spinning wind pushes water onshore on one end of the eye and offshore on the other. Picture drawing a circle that crosses a line, and see how the pencil moves toward the line at one point and away at another.
The most pronounced water movement is under the strong winds of the eyewall, explains Brian McNoldy, a University of Miami senior researcher on tropical storms.
Milton’s path toward the central part of Florida’s west coast was clear for days, raising the possibility that Tampa Bay could bear the brunt of the surge. But it is always tricky to predict exactly where landfall will happen — and when, which can be important because a daily high tide can accentuate a surge.
To be sure, hazardous wind, rain and some degree of surge can happen far from the center. But the exact location of landfall makes a big difference in where a surge peaks, McNoldy said. Same goes for a reverse, or “negative,” surge.
Ultimately, the center of east-northeastward-moving Milton made landfall Wednesday night at Siesta Key, near Sarasota. It is about 70 miles (112 kilometers) south of the city of Tampa.
That meant fierce onshore winds caused a storm surge south of Siesta Key. The National Hurricane Center said Thursday that preliminary data shows water rose 5 to 10 feet (1.5 to 3 meters) above ground between Siesta Key and Fort Myers Beach.
More than 19 million Americans may be exposed to unsafe drinking water, researchers warn.
Millions of Americans may be exposed to contaminated drinking water systems that are dangerous for their health, an updated interactive map shows.
The map, a collaborative effort by Environmental Working Group, a nonprofit, nonpartisan organization, and Northeastern University‘s Social Science Environmental Health Research Institute, documents toxic fluorinated compounds known as PFAS at publicly known pollution sites across the U.S., including public water systems, military bases, military and civilian airports, industrial plants, dumps and firefighter training sites.
The researchers found at least 610 drinking water sources in 43 states contain potentially unsafe PFAS levels, and estimate that more than 19 million people are exposed to these man-made chemicals that have been linked to birth defects, increased risk of thyroid disease, infertility and reduced immune responses in children.
“The Environmental Protection Agency has utterly failed to address PFAS with the seriousness this crisis demands, leaving local communities and states to grapple with a complex problem rooted in the failure of the federal chemical regulatory system,” said Ken Cook, president of Environmental Working Group, in a press release. “EPA must move swiftly to set a truly health-protective legal limit for all PFAS chemicals, requiring utilities to clean up contaminated water supplies.”
Any detection of these chemicals were included in the interactive map, despite some of the levels being well below the Environmental Protection Agency’s “non-binding health advisory” standard of 70 parts per trillion, said Bill Walker, editor-in-chief of the Environmental Working Group, via email.
“We, along with many states and academic scientists, regard that number as far too high,” said Walker, who wrote the map’s accompanying reportlet. “EWG endorses studies by Dr. Phillipe Grandjean of Harvard that say levels as low as 1 (part per trillion) could have adverse health effects such as repressed immune function in children. Therefore, we believe a map showing only detections above the EPA advisory would be misleading as to the true extent of the contamination crisis.”
However, a spokesperson for the Environmental Protection Agency cautions the map “seems to show any samples for PFAS chemicals that have been collected, which may or may not be detections.”
“EPA has not fully reviewed the quality of the underlying data, and based on the agency’s commitment to good risk communication with the public, EPA cannot recommend the map be used to determine where public health risks associated with PFAS chemicals may or may not exist,” John Konkus, the EPA’s deputy associate administrator for public affairs, wrote in an email. “The agency’s efforts continue to be focused on taking the actions committed to in the PFAS Action Plan.”
Michigan has 192 sites on the map, reflecting the most comprehensive testing program in the U.S., according to the press release, followed by California, at 47, and New Jersey, at 43. The map also documents 117 military sites.
“Leaders in many communities and states are doing great work to raise awareness about PFAS and push for cleanup, but this is a national crisis demanding national action,” Phil Brown, director of the Social Science Environmental Health Research Institute, said in a press release. “The EPA should act more quickly to evaluate all PFAS chemicals and restrict their use, and polluting industries should be held responsible.”
In March, a bipartisan pair of PFAS-monitoring bills were introduced in U.S. Congress to “inform and enhance assessments of exposure, likely health and environmental impacts, and remediation priorities,” according to the House version of the bill. Meanwhile, the Centers for Disease Control and Prevention and Agency for Toxic Substances and Disease Registry are calling for researchers to apply for a multi-site project on the human health effects of PFAS exposure.
River dwellers carry water gallons, on the sandbanks of the Madeira river, to bring to the isolated region of Paraizinho community, during the worst drought of the river in history, Humaita, Amazonas state, Brazil September 8, 2024. REUTERS/Bruno Kelly
By Bruno Kelly
HUMAITA, Brazil (Reuters) – Water levels in the rivers that run through the vast Amazon rainforest have been falling, after a record drought followed by less rain, presenting unprecedented challenges for the Ribeirinhos people living there.
Generative AI Too Disruptive for Its Own Good: DeepAI FounderPlay Video
With rivers becoming more difficult to navigate and water too dirty to consume, many of the traditional rural population who live on river banks have been relying on outside supplies of drinking water.
Francisca das Chagas da Silva, a resident, said older people in particular have struggled because they needed to walk much further to get water. “We have to carry it from the riverbanks to our homes,” she said.
The Ribeirinhos usually get water directly from rivers or have connected systems – but these means of supply fail when water levels drop so dramatically.
Now, many residents rely on non-governmental organizations or the state government for drinking water.
Joao Ferreira Mendonca, a community leader, said the river bank was about 800 meters (0.5 miles) away from some homes, a long distance for an older person or one with health problems.
“Now imagine a person in the hot sun, people with high blood pressure, doing this journey,” he said.
The Brazilian Geological Service, SGB, has warned in recent days that all rivers in the Amazon basin were expected to drop below their historical levels.
Ribeirinhos usually live on river banks in pile dwellings – from where they move with motor boats.
Rosicleia Gomes Vieira, another resident, said life in general was becoming much more isolated because the low water levels make navigation more difficult and impossible to carry produce to the city.
Other than the rivers, which have long been the main way of transport for residents, there is only a long dirt road that cuts through the dense rainforest.
In Brazil, where wildfires have also occurred, the low water levels are also hitting soy and corn shipments in center-west states such as Mato Grosso, Brazil’s number one grains growing area.
(Reporting by Bruno Kelly in Humaita and Lisandra Paraguassu in Brasilia; Writing by Stefanie Eschenbacher; editing by Diane Craft)
A study of chemicals in U.S. drinking water found that arsenic, even in small concentrations, is responsible for disproportionate numbers of cancer cases.
Chemicals present within legal limits in tap water are projected to be responsible for more than 100,000 cancer cases in the U.S., according to estimates from a new study.
The study, published Thursday in the journal Heliyon, looked at nearly 50,000 water systems across the country. It analyzed the presence of 22 cancer-causing chemicals that are regulated by states and the Environmental Protection Agency but still found in varying degrees in drinking water.
Researchers with the Environmental Working Group, a nonprofit advocacy organization, said the study is the first to project on a national level the cancer risk the combination of chemicals pose over a person’s statistical lifetime – about 70 years.
They found that the majority of cancer cases came from water systems that were fully complying with drinking water standards set either by states or the EPA.
“Water that meets legal standards still poses health risks,” says Sydney Evans, the lead author of the study and a science analyst at Environmental Working Group.
Of the nearly two dozen chemicals examined, the biggest problem is arsenic, which even in small concentrations is responsible for disproportionate numbers of cancer cases, according to the study. But Evans says that this study is an attempt to start looking at the chemicals present in water as a mixture instead of assessing them one by one.
The analysis is conservative, according to Evans, because it only looked at chemicals with national monitoring data or health benchmark levels. Many more chemicals exist in drinking water that haven’t been studied enough to include in the assessment, Evans says.
The study does not include measurements from private wells, which roughly 13.5 million Americans rely on for drinking water. Private wells don’t have to follow federal drinking water standards.
A water filter is a good “first course of action for an individual who is concerned,” Evans says. Residents should check their local water reports to know what kind of filter would be best for the types of chemicals present where they live.
The study shows that tougher standards for drinking water are needed, according to Evans.
“Filters aren’t a solution,” Evans says. “They’re a measure people can take right now until their water quality is improved.”