Exposure to PFAS in drinking water linked to higher blood levels of these “forever” chemicals
First-of-its-kind study at ADLM 2025 lays the foundation for addressing public health threat
Share
- Share On Facebook
- Share On Instagram
- Share On Twitter
- Share On Linkedin
- >Share With Email
CHICAGO — Breaking research presented today at ADLM 2025 (formerly the AACC Annual Scientific Meeting & Clinical Lab Expo) found that people who live in areas with higher levels of PFAS in their drinking water also have elevated blood levels of these manufactured chemicals. Highlighting why these so-called “forever chemicals” are a growing public-health concern, these findings provide support for policies encouraging more PFAS testing and treatment in public water systems.
“Drinking water is one of the most important routes for exposure to environmental contaminants, including PFAS,” said Dr. Wen Dui, a member of the research team from Quest Diagnostics that conducted the study. “This study was the first of its kind to apply the National Academies of Science, Engineering, and Medicine (NASEM) PFAS guidance to study correlation between PFAS in human bodies and drinking water in a large-scale clinical population.”
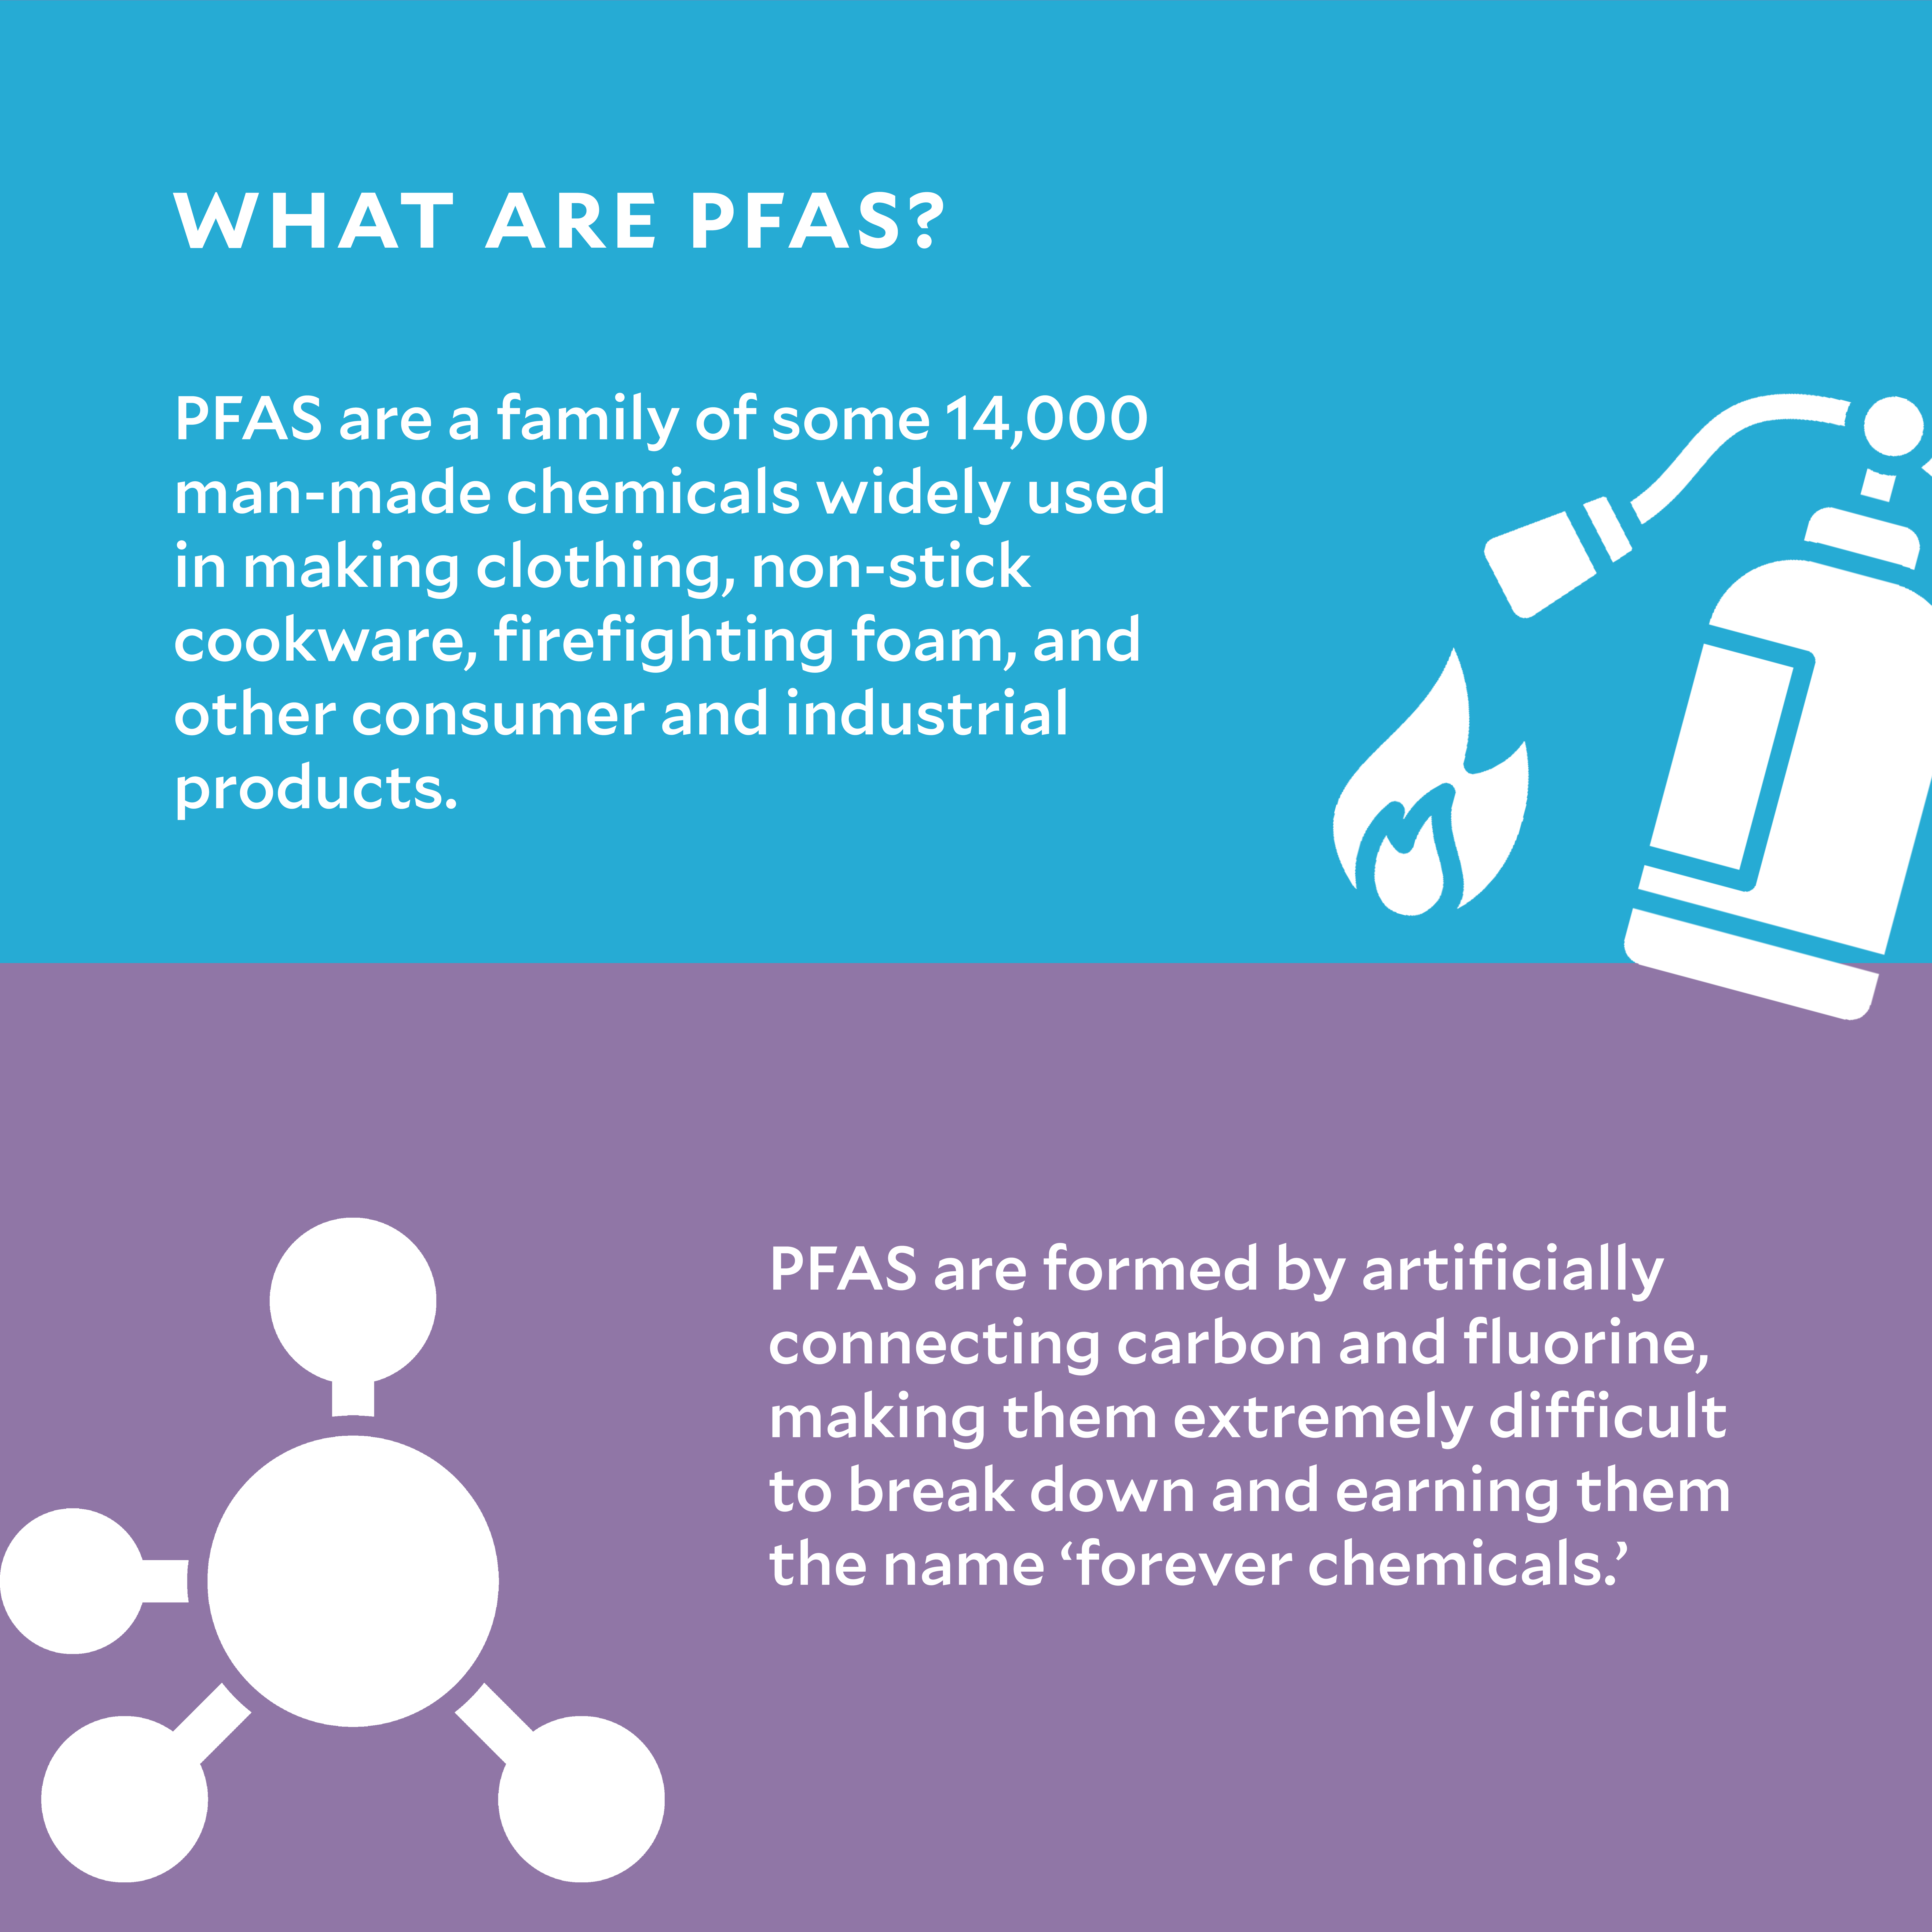
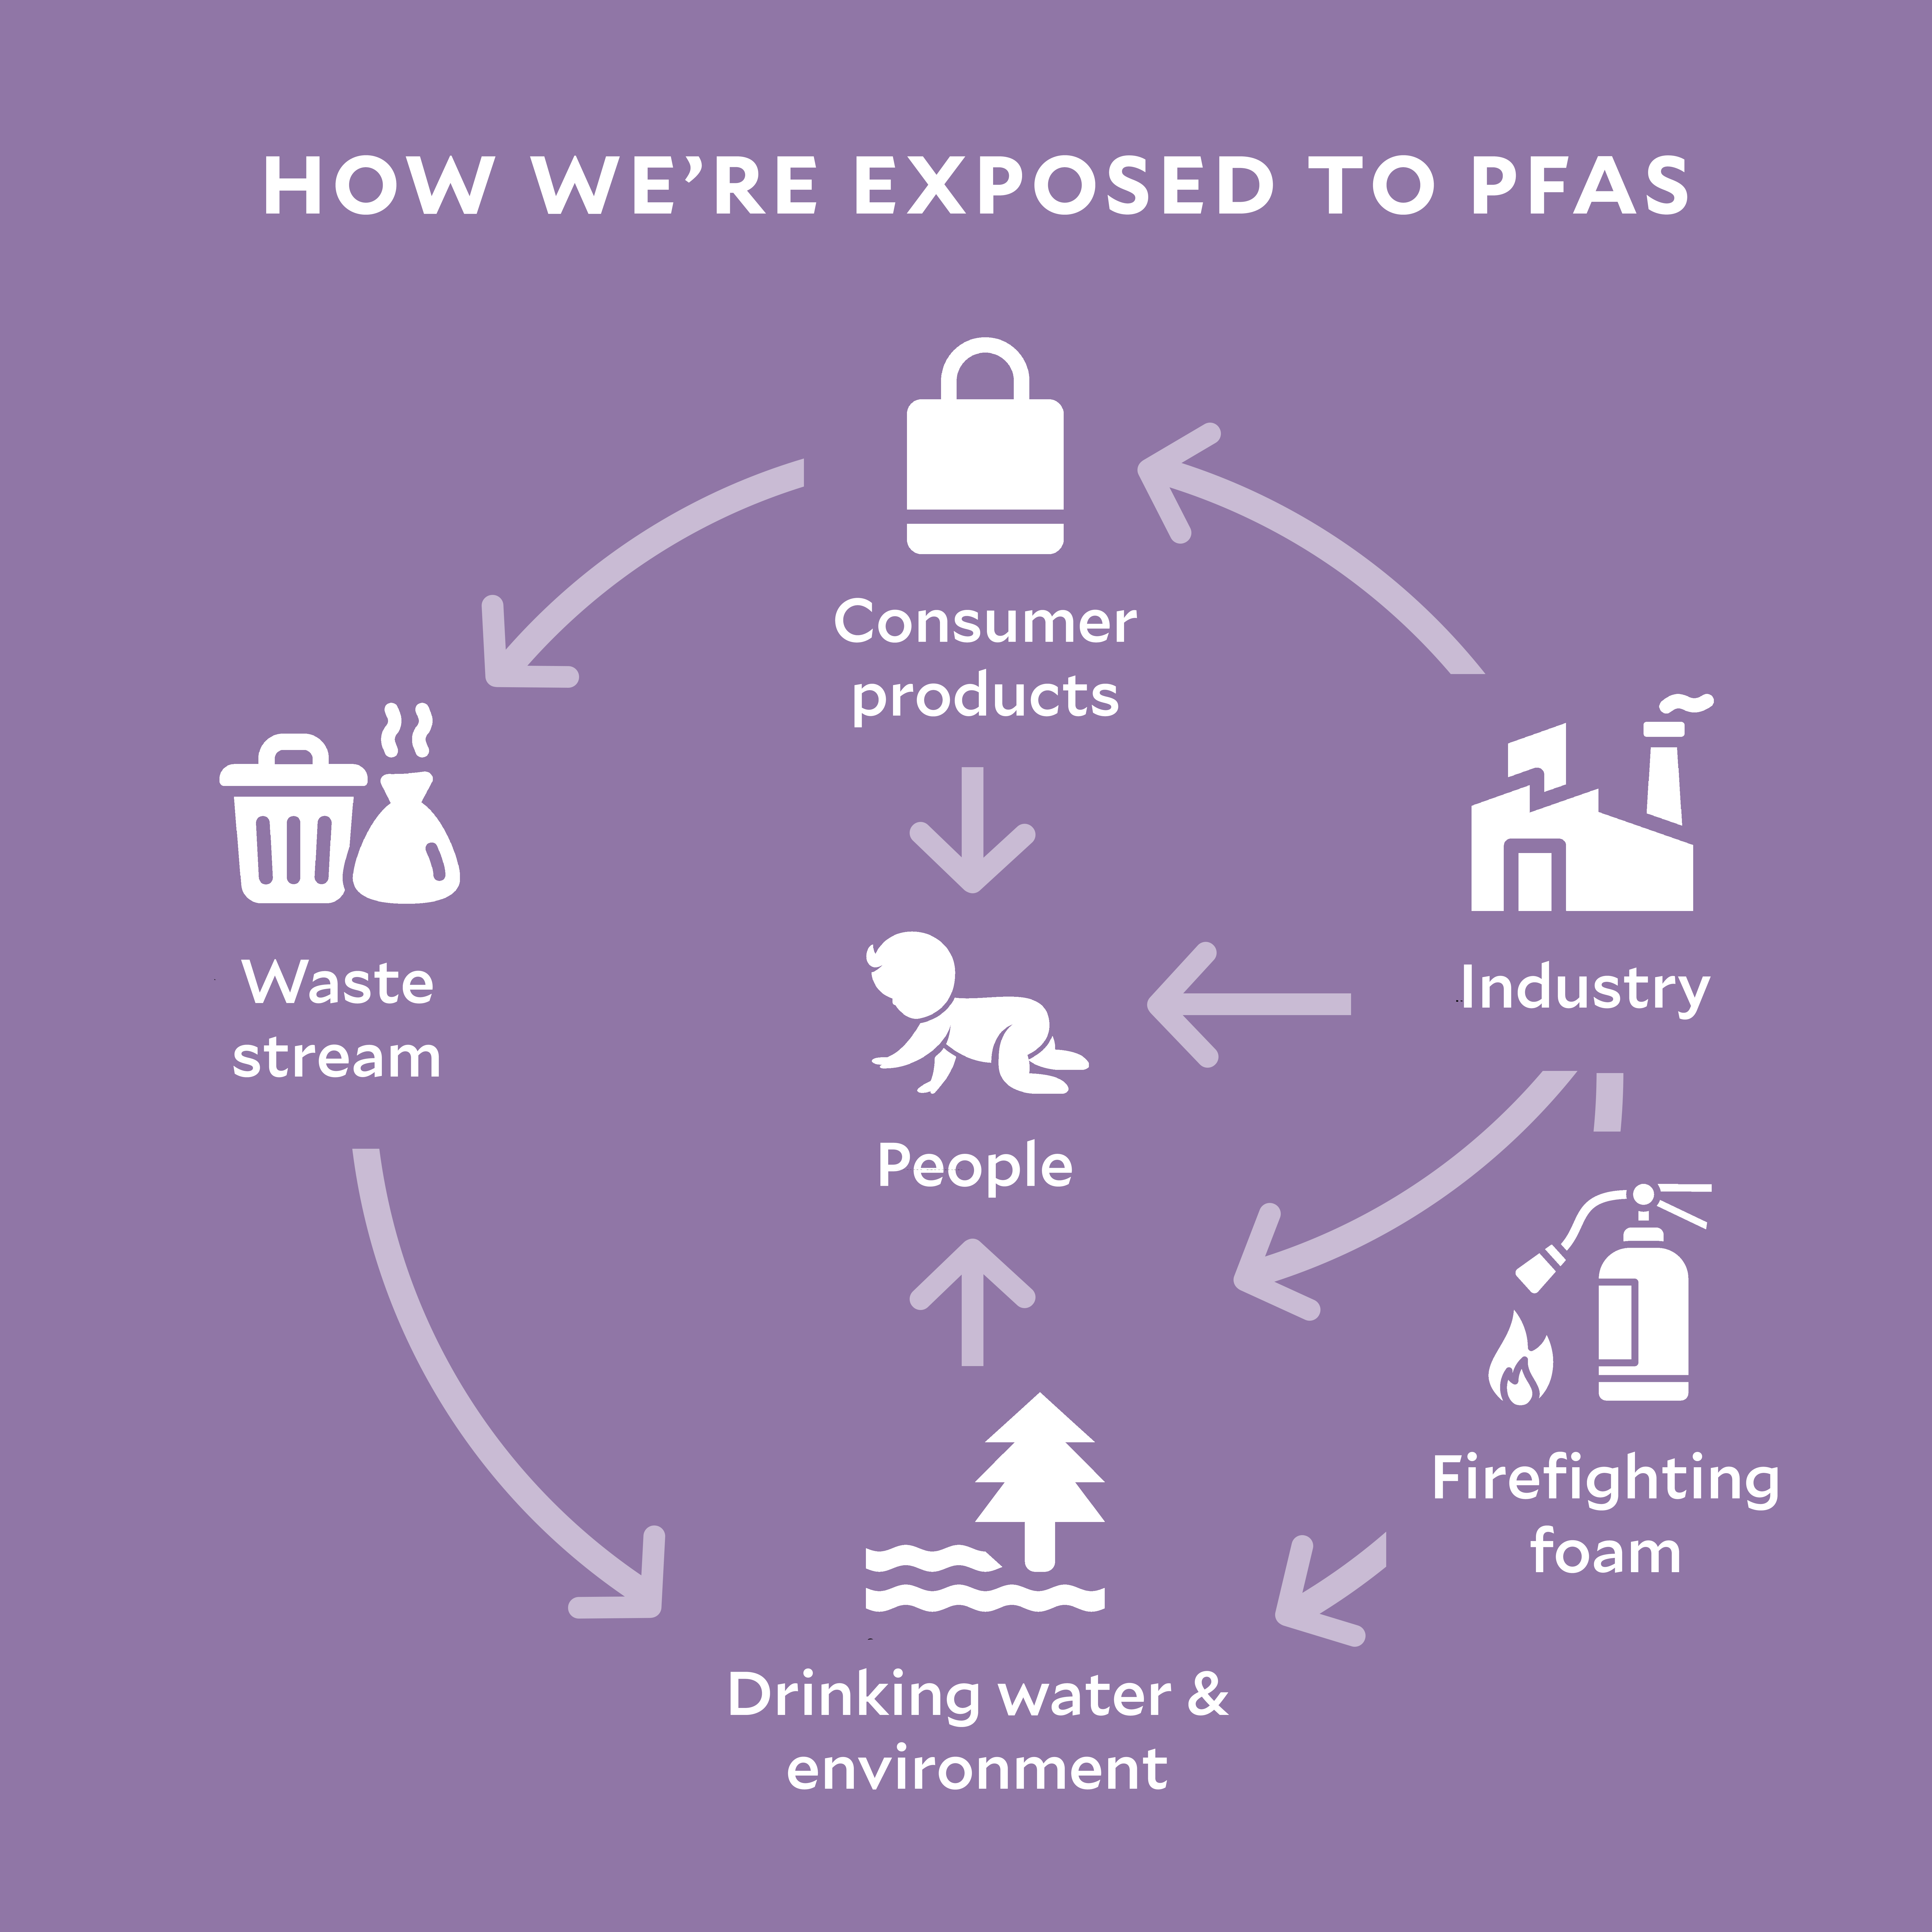
First developed in the 1940s, PFAS, or per- and poly-fluoroalkyl substances, were designed to resist water, oil, grease, and heat, making them useful in numerous consumer products and across multiple industries. For example, PFAS can be found in non-stick cookware, waterproof clothing, and fast-food packaging, as well as in firefighting foams, aircraft components, medical devices, and construction materials. The substances can enter the public water supply when manufacturers release wastewater into nearby water sources, for example, or when PFAS in landfills leach into groundwater.
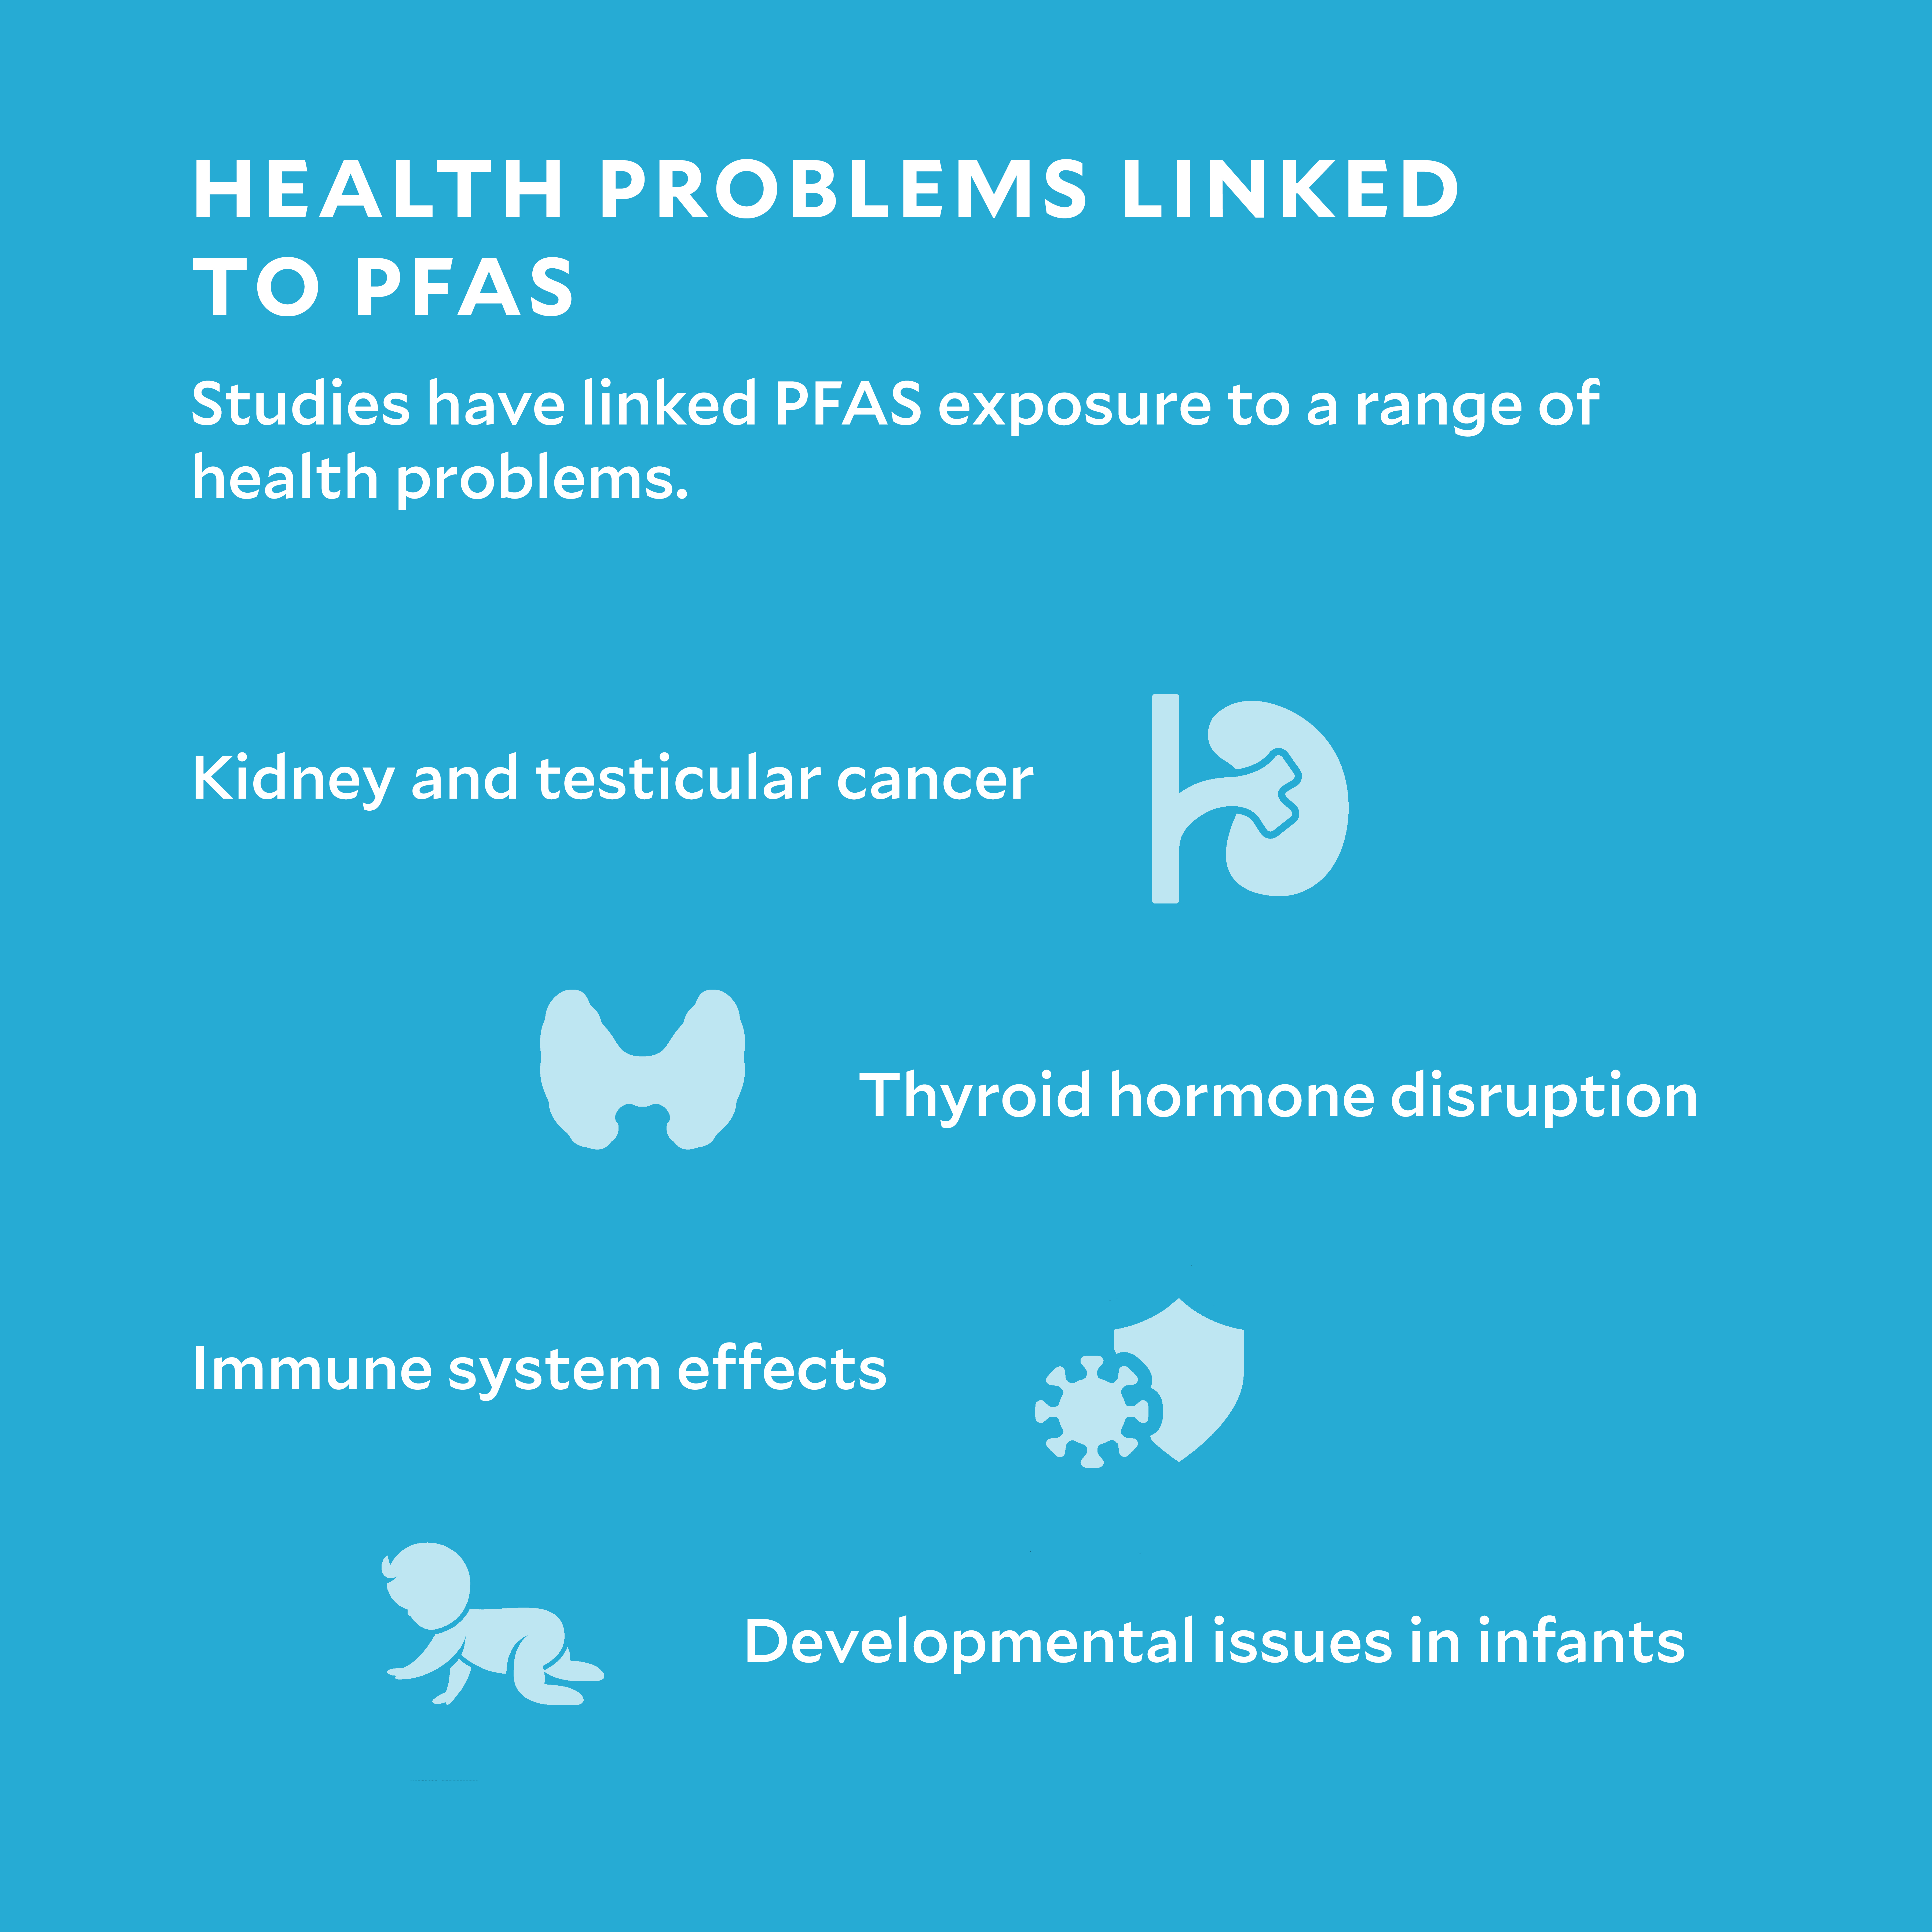
Scientists are concerned about possible health consequences of PFAS, which build up in people and the environment over time. For instance, NASEM found evidence of an association between PFAS and adult kidney cancer, decreased infant and fetal growth, abnormally high cholesterol, and a reduced antibody response. The NASEM guidance recommends that anyone with high blood levels of PFAS, defined as a summed total of more than 20 ng/mL of nine key PFAS, receive further testing and reduce their exposure.
“Several federal agencies, including the Centers for Disease Control and Prevention and NASEM, have worked together to summarize evidence, publish guidance, and encourage more clinical PFAS testing,” Dui said. “Quest developed and published a blood test for serum PFAS quantitation of the nine NASEM-recommended analytes to address the critical need for reliable PFAS measurement in clinical laboratories,” Dui said.
As one of its first steps, the team sought to establish the relationship between drinking water contaminated with PFAS and PFAS levels in people’s blood — which is what this new study accomplishes.
Since the U.S. Environmental Protection Agency monitors the amount of PFAS in public water systems, the researchers were able to pull information from previously collected blood samples to do a geographic comparison by exposure level. They evaluated blood samples taken from 771 individuals who lived in zip codes with high exposure to PFAS through their water and 788 people with low exposure to the substances, ensuring the two groups were otherwise comparable in their age and gender distribution.
They found that 7.1% of the people from zip codes with high-exposure to PFAS had elevated blood levels of PFAS (>20 ng/mL), versus only 2.8% of the people in the low-exposure group — a significant difference. Moreover, the estimated average of combined PFAS in the blood samples was significantly higher in the high-exposure group (9.2 ng/mL) versus the low-exposure group (6.1 ng/mL), as were mean blood levels of each individual PFAS studied.
“Our study found that a higher PFAS level in U.S. public drinking water supply corresponds to higher PFAS serum concentrations in exposed communities,” Dui said, adding that, as a next step, the company hopes to contribute to research on the correlation between PFAS exposure and health outcomes.
Session information
ADLM 2025 registration is free for members of the media. Reporters can register online here: https://xpressreg.net/register/adlm0725/media/landing.asp
Abstract B-281: Correlation between PFAS forever chemical concentrations in remnant serum and public drinking water will be presented during:
Scientific poster session
Wednesday, July 30
9:30 a.m. – 5 p.m. (presenting authors in attendance from 1:30 – 2:30 p.m.)
The session will take place in the Poster Hall on the Expo show floor of McCormick Place, Chicago.
About ADLM 2025
ADLM 2025 (formerly the AACC Annual Scientific Meeting & Clinical Lab Expo) offers 5 days packed with opportunities to learn about exciting science from July 27-31 in Chicago. Plenary sessions will explore urgent problems related to clinical artificial intelligence (AI) integration, fake medical news, and the pervasiveness of plastics, as well as tapping into the promise of genomics and microbiome medicine for personalized healthcare.
At the ADLM 2025 Clinical Lab Expo, more than 800 exhibitors will fill the show floor of the McCormick Place Convention Center in Chicago, with displays of the latest diagnostic technology, including but not limited to AI, point-of-care, and automation.
About the Association for Diagnostics & Laboratory Medicine (ADLM)
Dedicated to achieving better health for all through laboratory medicine, ADLM (formerly AACC) unites more than 70,000 clinical laboratory professionals, physicians, research scientists, and business leaders from 110 countries around the world. Our community is at the forefront of laboratory medicine’s diverse subdisciplines, including clinical chemistry, molecular diagnostics, mass spectrometry, clinical microbiology, and data science, and is comprised of individuals holding the spectrum of lab-related professional degrees, certifications, and credentials. Since 1948, ADLM has championed the advancement of laboratory medicine by fostering scientific collaboration, knowledge sharing, and the development of innovative solutions that enhance health outcomes. For more information, visit www.myadlm.org.
CLICK HERE FOR MORE INFORMATION