SOUTH FLORIDA AWASH IN COW MANURE State Allows Massive Animal Waste Discharges to Surface and Ground Waters

ar-red-tide-manatee

Manatee death from red tide (https://www.all-creatures.org/articles/env-red-tide-manatee.html)

Tallahassee — As South Florida waters suffer new outbreaks of both toxic red tides and blue-green algae blooms, a major aggravating factor receives little attention – the rising tide of cow manure and liquid wastes from concentrated animal feeding operations in the region, according to a new analysis released today by Public Employees for Environmental Responsibility (PEER).  Florida’s permitting system for these CAFOs is so lax that it facilitates huge amounts of nitrogen and phosphorus reaching its waters without any meaningful check or consequences.

The PEER analysis looks at 31 CAFO permits that the Florida Department of Environmental Protection (DEP) has issued in the seven-county area south of Orlando, with most in Okeechobee County directly to the north of Lake Okeechobee. These facilities hold approximately 90,000 dairy cows producing nearly two billion pounds of manure per year and more than 10 milliongallons of wastewater each day. The PEER analysis breaks down the ultimate destination of this huge waste stream.

“There is far greater focus on the massive discharges of nutrient-laden water from Lake O than on how these nutrients ended up there in the first place,” stated Florida PEER Director Jerry Phillips, a former DEP enforcement attorney, pointing out that just these 31 CAFOs annually generate net amounts in excess of 20 million pounds of nitrogen and 7.5 million pounds of phosphorous available for discharge into the environment.  “Despite obviously large impacts, Florida officially presumes that these CAFOs are not a source of pollution through a special brand of regulatory wishful thinking.”

274px-Confined-animal-feeding-operation

Concentrated animal feeding operation (Wiki Image, 2007)

The DEP permit system merely asks CAFOs to follow management practices and to report the amount of waste applied but does not look at where the wastes ultimately go.  In addition, the state permits –

  • Allow CAFOs to build and operatewaste management systems that fail in major storm events, e.g. hurricanes and floods, knowing that they will not be held liable for pollution during these events;
  • Contain few safeguards against groundwater contamination. None of the permits set specific limits on the amount of fecal coliform, nitrogen, phosphorus, ortho phosphate, or turbidity that may enter the groundwater; and
  • Rely on CAFO best management practices that are often “suggested” rather than mandatory. Words such as “should” are frequently used, leaving pollution control as largely aspirational in nature, with permit conditions that are typically unenforceable.

“Florida’s CAFO permitsdo not tell the DEP, or the public, the volume of contaminates each facility is discharging each month,” added Phillips, noting that there have been only 5 enforcement actions taken by the DEP against these facilities and that all but one of them were over a decade old.  “The cumulative effects of this ongoing, unabated pollution burden on Florida’s waters is now taking an undeniable toll, prompting state of emergency declarations. It is not just the chickens, but the dairy cows too. that are coming home to roost.”

https://www.peer.org/news/news-releases/south-florida-awash-in-cow-manure.html


JUST A REMINDER: REEF FRIENDLY SUNSCREENS!!

Skincare Chemical Threatens Coral Reefs

Common chemical is used in thousands of products to protect against harmful effects of ultraviolet light.

sunscreen-beachScientists have discovered that a common chemical used to protect against the damaging effects of ultraviolet light is highly toxic to juvenile corals and other marine life.


For more information from the site:  https://oceanservice.noaa.gov/news/nov15/sunscreen-corals.html

Since this report there have been found to be three major chemicals in sunscreens that affect coral reefs.  Please Google reef friendly sunscreens BEFORE you slather up and jump in the water:


3.-Is-Your-Sunscreen-Really-Protecting-You.gif

Water Warning in Lee County

Cyanobacteria Lake O 6.2018NOAA satellite images showing progression of cyanobacteria in Lake Okeechobee, from June 12 to June 24, 2018.
WATER WARNING: LEE COUNTY DEPARTMENT OF HEALTH REMINDS RESIDENTS AND VISITORS TO AVOID CONTACT WITH ALGAE
unnamed (1)
There is never a good time for bad water quality but summer holidays make it critical that we get the word out.
A blue-green algae bloom that covers a majority of Lake Okeechobee and miles of river and estuary has tested positive for toxins. Please avoid contact with green water. Boating through blooms can release toxins. Do not eat fish caught in green water. Pets and livestock should also stay out of green water.
The Florida Poison Information Centers are available 24/7 365 days per year to answer questions related to health issues from harmful algal blooms, including cyanobacteria. Their toll-free number is 1-800-222-1222.
The Lee County Dept of Health issued the following warning:
unnamed (1)
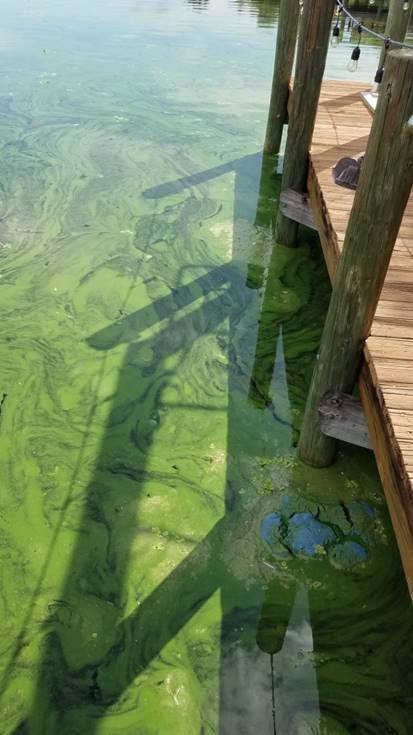
Lee County, Fla. – The Florida Department of Health in Lee County (DOH) is issuing a health advisory for the Alva Boat Ramp, Davis Boat Ramp, and Franklin Locks based on water sampling results from the Florida Department of Environmental Protection (DEP). DEP conducted sampling in the area and
found the presence of Cyanobacteria, commonly known as blue-green algae. When algae is visible, DOH recommends individuals using the boat ramp avoid contact with the water. DEP will continue to monitor the Alva Boat Ramp, Davis Boat Ramp, and Franklin Locks and post updates on their website.
Blue-green algae can cause gastrointestinal effects if swallowed. Children and pets are especially vulnerable, so keeping them away from the water during a bloom is especially important. Additional information on blue-green algae is available here. If you spot blue-green algae, please contact Kalina Warren, environmental administrator with DEP’s Water Quality Assessment Program for the South Region at 407-897-4177.
Contact:
Florida Department of Health in Lee County
407-897-4177
FOR MORE INFORMATION FROM SOURCE:  Sanibel Captiva Conservation Foundation | 3333 Sanibel Captiva RoadSanibel, FL 33957

Florida Legislators OK Plan to Dump Sewage Into Drinking-Water Aquifers

Screen Shot 2018-03-14 at 9.08.05 AM

Miamians get nearly all of their drinking water from the Biscayne Aquifer, a clean source of natural H2O that stretches underground from the southern tip of the state north to Palm Beach County. This being Florida, developers, utility companies, and scammers of all stripes are constantly devising new and ingenious ways to contaminate the aquifer. The water system already faces serious threats from sea-level rise and saltwater leaking from Florida Power & Light’s Turkey Point Nuclear Generating Station.

Now the state Legislature has decided to allow companies to dump “treated” sewage into drinking-water sources.


READ MORE HERE:  http://www.miaminewtimes.com/news/florida-bill-allows-sewage-dumping-in-drinking-water-aquifers-10159304

STUDENTS WIN FIRST AND THIRD

Once again, students from Oxbridge Academy beat out the college students to win research prizes for their independent studies regarding water health and community

Unknown

investment.  Studies ranged among:  fishing waste, fisherman attitudes towards bait management, St. Lucie River Estuary Algal plumes, edible plastics for bait bags, septic system effects on local beaches, and the effects of sunscreens on our coral reefs.  Well Done you amazing young people!


For more info: https://www.swfwrc.org/


STUDENT WINS FIRST PLACE

Martina was the first high school student to ever win first place!  She was working on sunscreens, their effects on coral reefs, and consumer awareness.  She’s a SUPERSTAR!Screen Shot 2018-02-16 at 8.03.06 AMoxbridgeacademy  Congrats to Martina Cavard on winning the poster contest in the American Water Resources Association Annual (AWRA) Conference held in Oregon! Oxbridge was the only high school at the conference and Martina competed against undergraduate and graduate students for this award. Well done Martina!


PROTECT SOILS AND SOURCE WATERS WHEN DE-ICING

Remember that CaCl may be a better solution than NaCl for ice control. Salt can damage metals and concrete as well as kill vegetation and seep into source waters.  Calcium on the other hand is needed for plant growth!

Check in with your local extension office for recommendations! (https://nifa.usda.gov/extension)

Screen Shot 2017-12-22 at 8.26.24 PMTaken from: www.extension.purdue.edu

For more information regarding salt damage:

https://www.extension.purdue.edu/extmedia/id/id-412-w.pdf

Oxbridge senior finishing up 2-year research project on algae blooms

Screen Shot 2017-10-27 at 4.25.35 PMPosted: 10:31 a.m. Monday, October 23, 2017


While his classmates at Oxbridge Academy spent their summers traveling, on the beach or in dozens of other pursuits, senior Robbie Linck spent his in a lab in Jupiter and in the field, doing research on algae blooms within Lake Okeechobee and the St. Lucie Watershed.

Linck’s project evaluates whether groundwater samples taken from the St. Lucie Watershed contain sucralose, an indicator of the presence of human feces. His findings will assist in determining whether improperly functioning septic systems are a contributing factor to algae growth in the area waterways. He’ll present his findings at the American Water Resource’s Association’s Annual Conference in November.

A native of Palm Beach, Linck has been engrossed in his research project for two years.

Q: How did you get started on the project?

A:It was through the program (Oxbridge teacher Dr. Teresa Thornton) started, “GET WET,” in conjunction with the University of Maine, that I’m able to even do this kind of work at my age.

Q: And then?

A: My research began as a semester-long biology project, but quickly transitioned into the two-year study that I’m still working on today. I chose the issue of algae blooms, and, with the help of Dr. Thornton, I was connected with BioTools, a Jupiter-based biotechnology company, where I conducted a large part of my research

Q: Which do you enjoy more: field research or work in the lab?

A: To be honest, I like them both. Working in the field and getting to really know the area that I’ve been focusing on was very important to me, but using all of the equipment in the lab was equally significant in allowing me to draw conclusions from the samples I’ve collected.

Q: When you’re not in the classroom, the lab or out in the field, how do you stay busy?

A: When I’m not involved in my scientific research, I’m almost always debating. I travel out of town almost every weekend to compete at national debate tournaments and, over the course of my four years at Oxbridge, I have climbed the ranks to now be the number one high school debater in the nation for Public Forum debate, my specific event.

Q: What do you intend to study in college?

A: While I’m passionate about the sciences, over the course of my four years at Oxbridge, I’ve simultaneously developed a love for government, ethics, mathematics and economics. I’m not entirely sure of the field that I want to pursue, but I’m definitely looking for something that will allow me the flexibility to pursue all my interests as well as to continue to develop my debating and research skills.


For more information:  http://www.palmbeachdailynews.com/news/local/oxbridge-senior-finishing-year-research-project-algae-blooms/tcbyM7SfnLydhuBblLtrmK/

The Immense, Eternal Footprint Humanity Leaves on Earth: Plastics

19PLASTIC-master768

Scientists have estimated that between 5 million and 13 million metric tons of plastic are put into the ocean each year. CreditGuillermo Cervera

If human civilization were to be destroyed and its cities wiped off the map, there would be an easy way for future intelligent life-forms to know when the mid-20th century began: plastic.

From the 1950s to today, 8.3 billion metric tons of plastic have been produced, with around half of it made since 2004. And since plastic does not naturally degrade, the billions of tons sitting in landfills, floating in the oceans or piling up on city streets will provide a marker if later civilizations ever want to classify our era. Perhaps they will call this time on Earth the Plastocene Epoch.

A new study in Science Advances published Wednesday offered the first analysis of all mass-produced plastics ever manufactured: how much has been made, what kind and what happens to the material once it has outlived its use.

Roland Geyer, the lead author of the study, said, “My mantra is that you can’t manage what you don’t measure, and without good numbers, you don’t know if we have a real problem.”

The authors, who come from the University of California, Santa Barbara, the University of Georgia and the Sea Education Association in Woods Hole, Mass., used plastic production data from a variety of sources to make their estimates.

Their findings suggest that staggering amounts of near-eternal litter is present in the environment — the oceans, landfills and freshwater and terrestrial ecosystems — and the numbers are quite likely to increase, with 12 billion metric tons accumulating in landfills or in the environment by 2050. (One metric ton is 1.1 short tons, the measure more commonly used in the United States.)

Scientists estimate that five million to 13 million metric tons of plastic enter the ocean each year, according to previous studies. New data suggests contamination in rivers and streams, as well as on land, is increasingly common, with most of the pollution in the form of microscopic pieces of synthetic fibers, largely from clothing.

The primary explanation for the rocketing rise in plastic is its use in packaging, which accounted for about 42 percent of nonfiber plastic production in 2015. Building and construction is the next largest plastic-consuming sector; it used 19 percent of nonfiber plastic that year.

The authors estimate that packaging, which is typically used for less than a year, made up 54 percent of the nonfiber plastic that was thrown away in 2015.

GRAPHIC

How Americans Think About Climate Change, in Six Maps

Americans overwhelmingly believe that global warming is happening, and that carbon emissions should be scaled back. But fewer are sure that it will harm them personally.

OPEN GRAPHIC

Most of the plastic that has been made is no longer in use — about 6.3 billion metric tons of plastic have been thrown away since 1950. About 12 percent of that has been incinerated, which is the only way to permanently dispose of plastic; 9 percent has been recycled, which only delays final disposal; and 60 percent — about 4.9 billion metric tons — is in landfills or scattered in the environment.

In Europe, 30 percent of nonfiber plastic is recycled, compared to 9 percent in the United States. Europe also burns more plastic — about 40 percent of its nonfiber plastic waste — while the U.S. incinerates around 16 percent. China recycles about 25 percent and burns about 30 percent of its plastic waste. The authors estimate that recycling, disposal and incineration rates in the rest of the world are probably similar to those in the United States.

Dr. Geyer cautioned that recycling was not a cure-all for global plastic pollution. He said the sole benefit of recycling was to reduce the amount of new plastic being produced, adding, “We don’t understand very well the extent to which recycling reduces primary production.”

The features that have made plastic so important in the global market are the same ones that make it such a pervasive pollutant: durability and resistance to degradation.

Dr. Geyer said there was not enough information on what the long-term consequences of all this plastic and its disposal would be. “It accumulates so quickly now and it doesn’t biodegrade, so it just gets added to what’s already there.”

“Once we start looking, I think we’ll find all sorts of unintended consequences,” he added. “I’d be very surprised to find out that it is a purely aesthetic problem.”

FOR MORE INFO:  https://www.nytimes.com/2017/07/19/climate/plastic-pollution-study-science-advances.html?smid=tw-nytimes&smtyp=cur&_r=0

As someone who cleans up plastic waste on the shoreline daily, finds and collects the waste when diving, and is willing to swim into the waters to retrieve grocery bags, bait bags, and other waste; this article meant a great deal.

WHAT CAN YOU DO IN YOUR AREA??


Reporting on the State of the Climate in 2016: International report confirms 2016 was third consecutive year of record global warmth

malawian-subsistence-farmer_reuters-mike-hutchings-1200x480A new State of the Climate report confirmed that 2016 surpassed 2015 as the warmest year in 137 years of recordkeeping.

Major indicators of climate change continued to reflect trends consistent with a warming planetLast year’s record heat resulted from the combined influence of long-term global warming and a strong El Niño early in the year. The report found that the major indicators of climate change continued to reflect trends consistent with a warming planet. Several markers such as land and ocean temperatures, sea level, and greenhouse gas concentrations in the atmosphere broke records set just one year prior.

These key findings and others are available from the State of the Climate in 2016 report released online today by the American Meteorological Society (AMS).

The 27th annual issuance of the report, led by NOAA National Centers for Environmental Information, is based on contributions from nearly 500 scientists from more than 60 countries around the world and reflects tens of thousands of measurements from multiple independent datasets (highlights, full report(link is external)). It provides a detailed update on global climate indicators, notable weather events, and other data collected by environmental monitoring stations and instruments located on land, water, ice, and in space.

The report’s climate indicators show patterns, changes, and trends of the global climate system. Examples of the indicators include various types of greenhouse gases; temperatures throughout the atmosphere, ocean, and land; cloud cover; sea level; ocean salinity; sea ice extent; and snow cover.

Report highlights include these indications of a warming planet.

Greenhouse Gases Highest on Record

Major greenhouse gas concentrations, including carbon dioxide (CO2), methane, and nitrous oxide, rose to new record high values during 2016. The global annual average atmospheric CO2 concentration was 402.9 parts per million (ppm), which surpassed 400 ppm for the first time in the modern atmospheric measurement record and in ice core records dating back as far as 800,000 years. This was 3.5 ppm more than 2015, and it was the largest annual increase observed in the 58-year record.

state-of-the-climate-2016-carbon-dioxide-graph.jpg

Graph of global carbon dioxide concentration levels
Courtesy of NOAA Climate.gov, adapted from State of the Climate in 2016

Global Surface Temperature Highest on Record

Aided by the strong El Niño early in the year, the 2016 annual global surface temperature observed record warmth for a third consecutive year, with the 2016 annual global surface temperature surpassing the previous record of 2015.

Global Lower Tropospheric Temperature Highest on Record

In the region of the atmosphere just above Earth’s surface, the globally averaged lower troposphere temperature was highest on record.

Sea Surface Temperatures Highest on Record

The globally averaged sea surface temperature was the highest on record. The more recent global sea surface temperature trend for the 21st century-to-date (2000–2016) of +2.92°F (1.62°C) per century is much higher than the longer term (1950–2016) warming trend of +1.8°F (1.0°C) per century.

Global Upper Ocean Heat Content Near-Record High

Globally, upper ocean heat content saw a slight drop compared to the record high set in 2015, but reflected the continuing accumulation of thermal energy in the top 2,300 feet (700 meters) of the ocean. Oceans absorb more than 90 percent of Earth’s excess heat from global warming.

Global Sea Level Highest on Record

Global average sea level rose to a new record high in 2016 and was about 3.25 inches (82 mm) higher than the 1993 average, the year that marks the beginning of the satellite altimeter record. This also marks the sixth consecutive year global sea level has increased compared to the previous year. Over the past two decades, sea level has increased at an average rate of about 0.13 inch (3.4 mm) per year, with the highest rates of increase in the western Pacific and Indian Oceans.

state-of-the-climate-2016-sea-level-map.jpg

Map of global sea level in 2016
Courtesy of NOAA Climate.gov

Extremes Were Observed in the Water Cycle and Precipitation

A general increase in the water cycle (the process of evaporating water into air and condensing it as rain or snow), combined with the strong El Niño, enhanced the variability of precipitation around the world. In addition to many parts of the globe experiencing major floods in 2016, for any given month at least 12 percent of global land was experiencing at least “severe” drought conditions, the longest such stretch in the record. Drought conditions were observed in northeastern Brazil for the fifth consecutive year, making this the longest drought on record in this region. The increased hydrologic cycle was also reflected, as it has been for more than a decade, by patterns of salinity (saltiness) across the globe’s ocean surface.

state-of-the-climate-2016-drought-map.jpg

Map of global drought and moisture conditions in 2016
Courtesy of NOAA Climate.gov

The report also documents key regional climate and climate-related events.

The Arctic Continued to Warm, Sea Ice Extent Remained Low

The average Arctic land surface temperature was 3.6°F (2.0°C) above the 1981–2010 average, breaking the previous record of 2007, 2011, and 2015 by 1.4°F (0.8°C), representing a 6.3°F (3.5°C) increase since records began in 1900. Average sea surface temperatures across the Arctic Ocean during August in ice-free regions ranged from near normal in some regions to around 13° to 14°F (7° to 8°C) above average in the Chukchi Sea and eastern Baffin Bay off the west coast of Greenland, and up to 20°F (11°C) above average in the Barents Sea. Increasing temperatures have led to decreasing Arctic sea ice extent and thickness. On March 24, the smallest annual maximum sea ice extent in the 37-year satellite record was observed, tying with 2015 at 5.61 million square miles, 7.2% below the 1981–2010 average. On September 10, the Arctic sea ice annual minimum extent tied with 2007 for the second lowest value on record, at 1.60 million square miles, 33 percent smaller than average. Arctic sea ice cover remains relatively young and thin, making it vulnerable to continued extensive melt.

Antarctic Sees Record Low Sea Ice Extent

During August and November, record low daily and monthly sea ice extents were observed, with the November average sea ice extent significantly smaller (more than 5 standard deviations) than the 1981–2010 average. These record low sea ice values in austral spring 2016 contrast sharply with the record high values observed during 2012–2014.

Global Ice and Snow Cover Decline

Preliminary data indicate that 2016 was the 37th consecutive year of overall alpine glacier retreat across the globe, with an average loss of 2.8 feet (852 mm) for the reporting glaciers. Across the Northern Hemisphere, late-spring snow cover extent continued its trend of decline, with new record low April and May snow cover extents for the North American Arctic. Below the surface, record high temperatures at the 20-meter (65-feet) depth were measured at all permafrost observatories on the North Slope of Alaska and at the Canadian observatory on northernmost Ellesmere Island.

Tropical Cyclones Were Well Above Average Overall

There were 93 named tropical cyclones across all ocean basins in 2016, well above the 1981–2010 average of 82 storms. Three basins—the North Atlantic and eastern and western North Pacific—experienced above-normal activity in 2016. The Australian basin recorded its least active season since the beginning of the satellite era in 1970.

The State of the Climate in 2016 is the 27th edition in a peer-reviewed series published annually as a special supplement to the Bulletin of the American Meteorological Society. The journal makes the full report openly available online.


FOR MORE INFO: http://www.ametsoc.net/sotc2016/ExecSummary.pdf