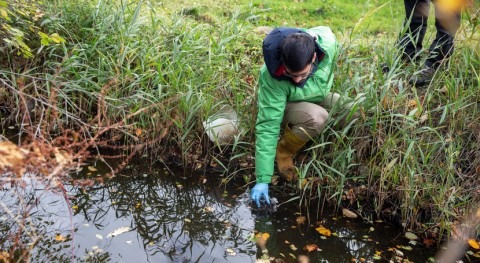
Several U.S. populations and regions exposed to high arsenic concentrations in drinking water

Columbia Researchers Warn: Several U.S. Populations and Regions Exposed to High  Arsenic Concentrations in Drinking Water

A new national study of public water systems found that arsenic levels were not uniform across the U.S., even after implementation of the latest national regulatory standard. In the first study to assess differences in public drinking water arsenic exposures by geographic subgroups, researchers at Columbia University Mailman School of Public Health confirmed there are inequalities in drinking water arsenic exposure across certain sociodemographic subgroups and over time. Community water systems reliant on groundwater, serving smaller populations located in the Southwest, and Hispanic communities were more likely to continue exceeding the national maximum containment level, raising environmental justice concerns. The findings are published online in Environmental Health Perspectives.

“This research has important implications for public health efforts aimed at reducing arsenic exposure levels, and for advancing environmental justice,” said Anne Nigra, PhD, postdoctoral research fellow in environmental health sciences, and first author. “Systematic studies of inequalities in public drinking water exposures have been lacking until now. These findings identify communities in immediate need of additional protective public health measures.”

‘Our objective was to identify subgroups whose public water arsenic concentrations remained above 10 µg/L after the new maximum arsenic contaminant levels were implemented and, therefore, at disproportionate risk of arsenic-related adverse health outcomes such as cardiovascular disease, related cancers, and adverse birth outcomes,” said Ana Navas-Acien, PhD, Professor of Environmental Health Sciences and senior author.

Arsenic is a highly toxic human carcinogen and water contaminant present in many aquifers in the United States. Earlier research by the Columbia research team showed that reducing the MCL from 50 to 10 µg/L prevented an estimated 200-900 cancer cases per year.

The researchers compared community water system arsenic concentrations during (2006-2008) versus after (2009-2011) the initial monitoring period for compliance with EPA’s 10 µg/L arsenic maximum contaminant level (MCL). They estimated three-year average arsenic concentrations for 36,406 local water systems and 2,740 counties and compared differences in means and quantiles of water arsenic between both three-year periods for U.S. regions and sociodemographic subgroups.

Analyses were based on data from two of the largest EPA databases of public water available. Using arsenic monitoring data from the Third Six Year Review period (2006-2011), the researchers studied approximately 13 million analytical records from 139,000 public water systems serving 290 million people annually. Included were data from 46 states, Washington D.C., the Navajo Nation, and American Indian tribes representing 95 percent of all public water systems and 92 percent of the total population served by public water systems nationally.

Regional Differences

For 2006-2008 to 2009-2011, the average community water system arsenic concentrations declined by 10 percent nationwide, by 11.4 percent for the Southwest, and by 37 percent for New England, respectively. Despite the decline in arsenic concentrations, public drinking water arsenic concentrations remained higher for several sociodemographic subgroups — Hispanic communities, the Southwestern U.S, the Pacific Northwest, and the Central Midwest., in particular. Likewise, communities with smaller populations and reliant on groundwater were more likely to have high arsenic levels.

The percent of community water systems with average concentrations arsenic above the 10 µg/L MCL was 2.3% in 2009-2011 vs. 3.2% in 2006-2008. Community water systems that were not compliant with the arsenic MCL were more likely in the Southwest (61 percent), served by groundwater (95 percent), serving smaller populations (an average of 1,102 persons), and serving Hispanic communities (38 percent).

Nigra and Navas-Acien say that estimating public drinking water arsenic exposure for sociodemographic and geographic subgroups is critical for evaluating whether inequalities in arsenic exposure and compliance with the maximum contaminant levels persist across the U.S, to inform future national- and state-level arsenic regulatory efforts, and to investigate whether inequalities in exposure by subgroup contribute to disparities in arsenic-related disease. “Our findings will help address environmental justice concerns and inform public health interventions and regulatory action needed to eliminate exposure inequalities.”

“We urge continued state and federal funding for infrastructure and technical assistance support for small public water systems in order to reduce inequalities and further protect numerous communities in the U.S. affected by elevated drinking water arsenic exposure,” said Nigra.make a difference: sponsored opportunity


Story Source:

Materials provided by Columbia University’s Mailman School of Public Health. Note: Content may be edited for style and length.


Journal Reference:

  1. Anne E. Nigra, Qixuan Chen, Steven N. Chillrud, Lili Wang, David Harvey, Brian Mailloux, Pam Factor-Litvak, Ana Navas-Acien. Inequalities in Public Water Arsenic Concentrations in Counties and Community Water Systems across the United States, 2006–2011. Environmental Health Perspectives, 2020; 128 (12): 127001 DOI: 10.1289/EHP7313

FOR MORE INFORMATION: Columbia University’s Mailman School of Public Health. “Several U.S. populations and regions exposed to high arsenic concentrations in drinking water.” ScienceDaily. ScienceDaily, 9 December 2020. <www.sciencedaily.com/releases/2020/12/201209094243.htm>.
Big data offers promise of better groundwater management in California

Big data offers promise of better groundwater management in California |  Newsroom - McGill University

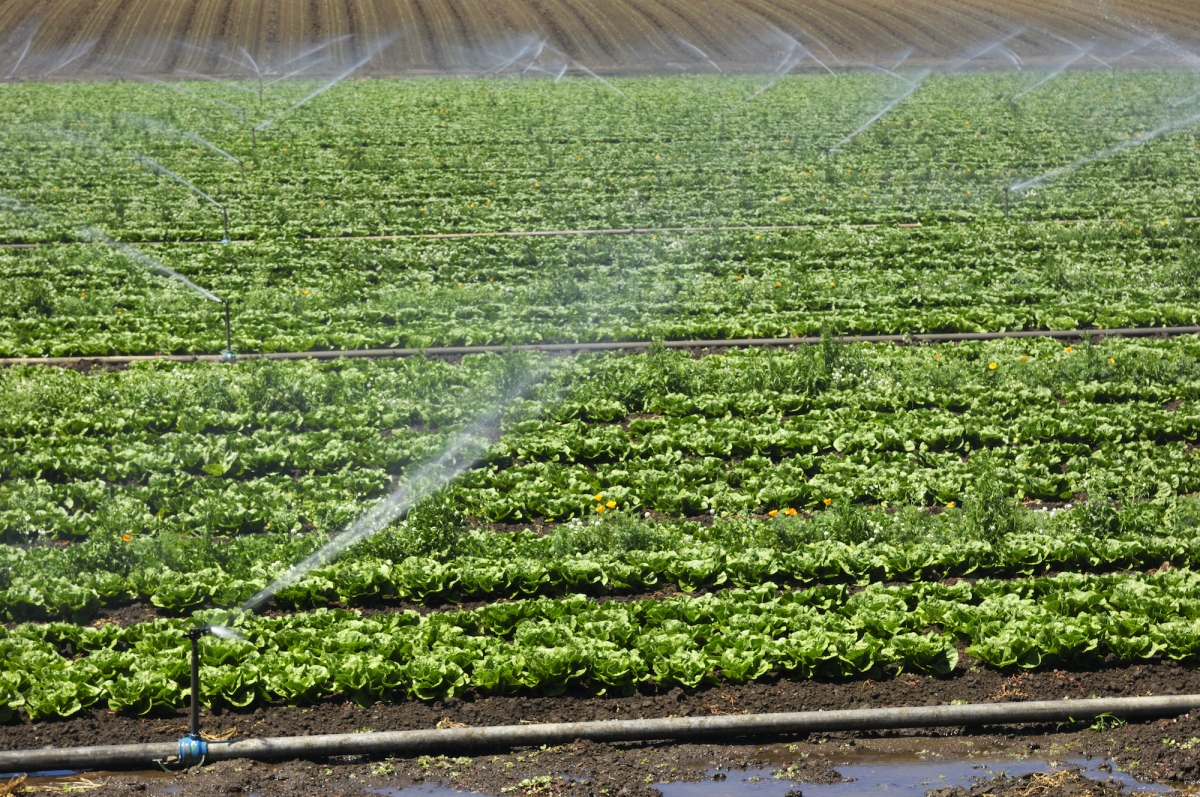
To ensure that California’s groundwater is sustainably managed in the future and over the long-term, current state definitions of what constitutes groundwater may need to be revised, according to research published this week in PNAS. A McGill University-led research team has analyzed big data of more than 200,000 groundwater samples taken from across the state and found that there are problems with the guidelines used for groundwater management. Known as the ‘Base of Fresh Water’, the guidelines are close to fifty years old and don’t reflect current uses, knowledge, concerns or technologies related to managing groundwater in this coastal state with a multi-billion-dollar agricultural industry.

The research shows that existing groundwater wells already penetrate and encroach upon the bases of fresh water that are used to define basin bottoms. In addition, brackish waters exist within current groundwater basins, and fresh water exists outside delineated groundwater basins. Brackish water, which was once deemed unusable, can now be used, thanks to technological advances. Finally, there are concerns about regulating groundwater on the basis of its quality rather than its usage, as is currently the case, since this provides a loophole for potential groundwater users who could drill deeper and skirt existing restrictions on freshwater pumping.

Together, these findings suggest that groundwater may already be poorly safeguarded in some places and that the ‘Base of Fresh Water’ concept may need to be reconsidered as a means to define and sustainably manage groundwater in future.

Need for up-to-date information to manage a critical resource

“It is challenging for groundwater sustainability agencies to manage groundwater because this critical resource is not being sufficiently monitored,” says Mary Kang, an Assistant Professor in McGill University’s Department of Civil Engineering and the lead author on the study. An expert on groundwater issues, she has studied the topic in California since 2014. “The base of fresh water was historically set to protect high quality groundwater from oil and gas development. And we find that there is a mismatch between this base of fresh water and what the water quality data shows.”

“One component to managing groundwater sustainably is evaluating the physical resource within the context of its users,” says Debra Perrone co-author of the study and Assistant Professor in UC Santa Barbara’s Environmental Studies Program. “We evaluate the link between groundwater quality, particularly salinity, and groundwater users. We show that the current approach used to manage deep groundwater in some places may risk overlooking the complex realities pertaining to both groundwater salinity and groundwater users. For example, the data suggest that people are constructing groundwater wells deeper than the base of fresh water in some areas.”

In 2014, in response to repeated droughts, the state passed the Sustainable Groundwater Management Act (SGMA) to regulate groundwater for the first time in California’s history. However, the effectiveness of this legislation is yet to be determined, as it relies upon administrative definitions of groundwater that are based on the extent of fresh water to define a vertical or three-dimensional groundwater basin for managing water.

“The Sustainable Groundwater Management Act currently only applies to fresh groundwater basins since administrative definitions of groundwater originated decades ago when it was economically infeasible to treat and distribute ‘unusable’ brackish or saline groundwater,” says co-author Melissa Rohde, a scientist with The Nature Conservancy of California. Rohde is currently providing scientific support to advance the successful implementation of SGMA. “With technological advances, brackish water is now usable and increasingly desirable with declining access to fresh water. By excluding brackish groundwater from sustainable groundwater management, we run the risk of undermining SGMA and overexploiting this important public resource.”make a difference: sponsored opportunity


Story Source:

Materials provided by McGill University. Note: Content may be edited for style and length.


Journal Reference:

  1. Mary Kang, Debra Perrone, Ziming Wang, Scott Jasechko, Melissa M. Rohde. Base of fresh water, groundwater salinity, and well distribution across California. Proceedings of the National Academy of Sciences, 2020; 202015784 DOI: 10.1073/pnas.2015784117

FOR MORE INFORMATION: McGill University. “Big data offers promise of better groundwater management in California: Analysis of 200,000 groundwater samples reveals major mismatch in California groundwater data.” ScienceDaily. ScienceDaily, 9 December 2020. <www.sciencedaily.com/releases/2020/12/201209170704.htm>.

New study allows regional prediction of uranium in groundwater

Landforms from Groundwater Erosion and Deposition ( Read ) | Earth Science  | CK-12 Foundation

Lurking in sediments and surrounding the precious groundwater beneath our feet is a dangerous toxin: uranium. Scientists have long known this and tested for it. But now Stanford researchers have identified the trigger that causes naturally occurring uranium to dislodge from sediments and seep into groundwater, pointing to a solution for managing the toxin before it becomes a problem.

In a new regional model that combines aquifer information with soil properties for predicting groundwater quality, the researchers pinpointed the factors associated with uranium contamination. The research, published in Environmental Science & Technology Dec. 8, indicates that calcium concentrations and soil alkalinity are key determining factors of uranium groundwater contamination in California’s Central Valley. The findings will be especially important as water managers plan for a future with more people and less water available from snowpack in a warming world.

Uranium is among the top three harmful, naturally occurring groundwater contaminants in the Central Valley, along with arsenic and chromium. The radioactive, metallic element becomes dangerous when consumed in high quantities, causing kidney damage and increased risk of cancer. It is prevalent within the Central Valley’s San Joaquin Valley, and also occurs naturally in semi-arid and arid environments worldwide.

Researchers focused on locations in the Central Valley aquifers where groundwater uranium concentrations have been observed to exceed the drinking water standard of 30 micrograms of uranium per liter.

“Every aquifer has one or more of these natural contaminants. The question is whether they sit benignly in the sediments or really cause problems by getting into the groundwater,” said co-author Scott Fendorf, the Huffington Family Professor in Earth system science at the School of Earth, Energy & Environmental Sciences (Stanford Earth). “Water managers can use our findings to forecast solutions before the problems are manifested.”

The study focuses on the chemical impacts of groundwater recharge, which is the process of rainfall seeping into soils and moving down into underlying aquifers. As rainwater seeps downward, its chemistry changes as it interacts with the ground environment. Pumping the water back out also influences the dynamics of the aquifer, which can change the chemistry of the system and how elements such as uranium are partitioned between the solids (sediments) and water. If the water picks up more calcium during its travels and also becomes more alkaline, it can attract uranium and contaminate aquifers, the researchers found.

“Our work shows that it’s not just properties of the aquifer that are impacting uranium, but factors such as clay content and pH of the soil that served as important predictors of groundwater uranium concentrations,” said lead study author Alandra Lopez, a PhD student in Earth system science. “It highlights the importance of including data about soil properties when generating aquifer vulnerability maps for a naturally occurring contaminant like uranium.”

The good news: the researchers estimate that the factors introducing this process of uranium loosening from sediments into groundwater mainly occur within the top six feet of the soil, suggesting an easy fix could involve bypassing that area.

“If you’re going to manage aquifer recharge, which will be increasingly needed with climate change, be careful about having the water infiltrate through the soil where calcium and alkalinity are often highest. These management scenarios are being considered right now,” said Fendorf, who is also a senior fellow at the Stanford Woods Institute for the Environment.

The team says their methodology offers water managers an easy way to predict major influences on groundwater uranium concentrations at scale.

“We’re trying to tell everybody that you need to think about this ahead of time, because that’s when you can manage around the problem,” Fendorf said. “It’s a kind of forward prediction versus hindsight reaction — once you measure uranium in the water, your problem is already at hand and it’s much more expensive to fix.”

This research was funded by the Water Foundation, a US National Science Foundation Graduate Research Fellowship and partly supported by the US Department of Energy, Office of Biological and Environmental Research, Subsurface Biogeochemistry Program (SBR).make a difference: sponsored opportunity


Story Source:

Materials provided by Stanford University. Original written by Danielle Torrent Tucker. Note: Content may be edited for style and length.


Journal Reference:

  1. Alandra M. Lopez, Arden Wells, and Scott Fendorf. Soil and Aquifer Properties Combine as Predictors of Groundwater Uranium Concentrations within the Central Valley, California. Environmental Science & Technology, 2020 DOI: 10.1021/acs.est.0c05591

FOR MORE INFORMATION: Stanford University. “New study allows regional prediction of uranium in groundwater.” ScienceDaily. ScienceDaily, 8 December 2020. <www.sciencedaily.com/releases/2020/12/201208111432.htm>.

Central Europe: Dry Aprils pave the way for summer droughts

Central Europe: Dry Aprils pave the way for summer droughts |  PreventionWeb.net

In the past 20 years, Central Europe has experienced six summer heat waves and droughts. Until now, however, it was unclear what factors led to these extreme events. Researchers from two Helmholtz Centres (AWI & UFZ) have now discovered that in Central Europe, temperature and precipitation patterns in April play a vital role in determining whether or not the soils are drier than average in the following summer. If the April is too warm, with little precipitation, a large proportion of the moisture stored in the soil evaporates, making a summer drought more likely. The team has also identified one of the reasons for the repeated dry Aprils and the correspondingly increased risk of drought. Decreasing temperature differences between the Arctic and the middle latitudes lead to a shift in the jet stream and the formation of a blocking high-pressure system over the North Sea and parts of Germany. This in turn means that the April weather in Central Europe is getting much too warm and dry, as the researchers report in a study released today in the Nature Partner Journals npj Climate and Atmospheric Science.

Monica Ionita, a climatologist and expert on weather forecasting at the Alfred Wegener Institute Helmholtz Centre for Polar and Marine Research (AWI), can still remember it clearly: in late April 2018, it was so hot in Bremen that she put a paddling pool in the garden for her daughter, although it should have been much too early to splash around outdoors. She now knows that the spring heat wave at the time provided the impetus for the following summer being one of the driest in the history of Central Europe.

“Since the turn of the century, Central Europe has experienced repeated summer heat waves and droughts, which have caused damage amounting to millions of Euros. To date, attempts to correctly predict such extreme events have been unsuccessful because the influence of the spring has been underestimated. That is why we decided to closely investigate the links between the weather in spring and that in the subsequent summer — for the entire period for which sufficient records are available. In other words, the last 140 years,” the expert reports.

April’s pivotal role: Lack of rain coupled with heat causes soils to dry out

For the analysis, Monica Ionita and her colleagues employed climate (and hydrologic) model outputs as well as statistical methods that the AWI researchers have developed; and had already successfully applied in long-term forecasts of river water levels. The findings show: in the last 14 years, the temperature and precipitation trends in April have changed fundamentally. “While there was little change in the months of March and May in the period 2007 to 2020, April was on average 3 degrees Celsius warmer compared to the reference period 1961 to 2000. In extreme years, like 2018, it was so warm in April that the snow that had fallen in winter virtually evaporated before it had the chance to drain into the soil in the form of meltwater. Furthermore, since 2007, in most regions of Central Europe there has only been half as much rain as in the reference period,” Ionita explains.

In the past 14 years, the absence of precipitation has only been one of the problems: “Rising April temperatures have led to the moisture stored in the soil evaporating. As a result, in spring there was already a marked lack of moisture in the soils of Central Europe, especially in Germany. As a rule, this deficit couldn’t be compensated for in the summer. In other words: the summer drought in the soils was pre-programmed back in April,” adds Rohini Kumar, a hydrologist at the Helmholtz Centre for Environmental Research (UFZ) in Leipzig and co-author of the new study.

The causes of dry springs in Central Europe

But which weather conditions over Central Europe cause the repeated record-high temperatures and dry spells in April? “Our analysis shows that a blocking high-pressure system formed over the North Sea and parts of Germany in that period, and this diverted the jet stream northwards, resulting in spells of sunny and dry weather in Central Europe lasting up to two weeks,” explains Ionita. There was also a phase with similarly low precipitation in April in the period from 1881 to 1895. But at the time it wasn’t as warm, which meant that less moisture evaporated from the soil and there weren’t the long-term effects that we’re seeing today. “The serious consequences of these spring dry spells are largely due to the rising air temperatures,” comments Ionita.

We can’t yet say whether blocking high-pressure systems will determine the April weather in Central Europe in the future, since the climate is subject to natural fluctuations. But in their study, the scientists were able to identify one important driver: “One reason for the formation of stable high-pressure areas is the decreasing temperature differences between the Arctic and the middle latitudes in spring. Under these conditions, the jet stream that controls the weather in Central Europe follows a zigzagging course, allowing the high-pressure system to settle over the North Sea,” Ionita adds.

According to climate scenarios, these initial conditions will also occur in the future. However, high-pressure systems will form less frequently (be less likely to form) if we succeed in achieving the Paris climate goals and limit global warming to 1.5 degrees Celsius by 2100. “If temperature increases exceed this goal, it is highly likely that such high-pressure areas will form. In Central Europe, the month of April will continue to be warmer and drier than it was 20-30 years ago, thus paving the way for large-scale water shortages and arid soils all summer long,” warns the AWI researcher.

“Such a development would have major effects on the soils’ water balance and their associated ecosystem services,” states Kumar, adding: “In recent years, we’ve seen a series of summer droughts throughout Central Europe — with severe consequences in terms of plant productivity and low water-levels in rivers. Understanding the conditions under which such dry periods occur is vital to implement precautionary and preventive measures in time.”make a difference: sponsored opportunity


Story Source:

Materials provided by Alfred Wegener Institute, Helmholtz Centre for Polar and Marine Research. Note: Content may be edited for style and length.


Journal Reference:

  1. M. Ionita, V. Nagavciuc, R. Kumar, O. Rakovec. On the curious case of the recent decade, mid-spring precipitation deficit in central Europe. npj Climate and Atmospheric Science, 2020; 3 (1) DOI: 10.1038/s41612-020-00153-8

FOR MORE INFORMATION: Alfred Wegener Institute, Helmholtz Centre for Polar and Marine Research. “Central Europe: Dry Aprils pave the way for summer droughts: Researchers identify the causes of dry springs and describe their long-term consequences.” ScienceDaily. ScienceDaily, 7 December 2020. <www.sciencedaily.com/releases/2020/12/201207112316.htm>.

Satellite-tagged bottles show promise for tracking plastic litter through rivers

Satellite-tagged bottles show promise for tracking plastic litter through  rivers

A new study demonstrates the potential for plastic bottles tagged with tracking devices to deepen our understanding of how plastic pollution moves through rivers. Emily Duncan of the University of Exeter, U.K., and colleagues present this research in the open-access journal PLOS ONE on Dec 2, 2020.

Plastic pollution threatens natural ecosystems and human health worldwide. Previous research suggests that rivers transport up to 80 percent of the plastic pollution found in oceans. However, while ocean modeling and tracking technology have revealed detailed insights into how plastic litter moves and accumulates within oceans, river transport of plastic pollution remains poorly understood.

To help address this knowledge gap, Duncan and colleagues developed a new, low-cost, open-source tracking method that uses reclaimed 500 mL plastic bottles to house custom-designed electronics, allowing the bottles to be tracked via GPS cellular networks and satellite technology. These “bottle tags” mimic plastic beverage bottles, in the hopes that they realistically replicate the path of plastic pollution down a river.

As part of the National Geographic Sea to Source Ganges Expedition, the researchers released 25 bottle tags at various sites along the Ganges River. They successfully tracked several of them through the river and into the Bay of Bengal. They also released three bottles directly into the Bay of Bengal to mimic paths followed by litter once it reaches the sea. The farthest distance traveled by any of the bottles was 2,845 kilometers, which took 94 days.

This study demonstrates that future research could use bottle tags to significantly boost understanding of plastic litter’s movement through rivers and into oceans. These devices could reveal new insights into areas where plastic litter is likely to accumulate and periods when large amounts of plastic pollution are moving through the waterways.

The authors also highlight the potential for bottle tags to engage the public — such as by enabling people to follow the bottles’ journeys for themselves — potentially boosting awareness, discouraging littering, and informing changes to pollution policy.

The authors add: “Our ‘message in a bottle’ tags show how far and how fast plastic pollution can move. It demonstrates that this is a truly global issue, as a piece of plastic dropped in a river or ocean could soon wash up on the other side of the world.”make a difference: sponsored opportunity


Story Source:

Materials provided by PLOS. Note: Content may be edited for style and length.


Journal Reference:

  1. Emily M. Duncan, Alasdair Davies, Amy Brooks, Gawsia Wahidunnessa Chowdhury, Brendan J. Godley, Jenna Jambeck, Taylor Maddalene, Imogen Napper, Sarah E. Nelms, Craig Rackstraw, Heather Koldewey. Message in a bottle: Open source technology to track the movement of plastic pollution. PLOS ONE, 2020; 15 (12): e0242459 DOI: 10.1371/journal.pone.0242459

FOR MORE INFORMATION: PLOS. “Satellite-tagged bottles show promise for tracking plastic litter through rivers: Researchers successfully track ‘bottle tags’ through Ganges River system into Bay of Bengal.” ScienceDaily. ScienceDaily, 2 December 2020. <www.sciencedaily.com/releases/2020/12/201202192806.htm>.

Climate change warms groundwater in Bavaria

Climate change warms groundwater in Bavaria - Naveen Bharat eन्यूज़ पोर्टल  - Today's Truth

Groundwater reservoirs in Bavaria have warmed considerably over the past few decades. A new study by researchers at Martin Luther University Halle-Wittenberg (MLU) compares temperatures at 35 measuring stations, taken at different depths, with data from the 1990s. Water found at a depth of 20 metres was almost one degree warmer on average than 30 years ago. The findings were published in the journal “Frontiers in Earth Science.”

As the air warms, the ground also becomes warmer over time — ultimately resulting in warmer groundwater. Geologists call this thermal coupling. “Unlike the atmosphere, however, the earth’s sub-surface is very sluggish,” explains Professor Peter Bayer, a geoscientist at MLU and co-author of the study. Because the ground below the surface does not react to short-term temperature fluctuations and thus tends to reflect long-term trends, it is a good indicator of climate change.

“This ground warming effect has been known to scientists, however there is still little data on it,” explains Bayer. For the new study, Bayer and his doctoral student Hannes Hemmerle repeated measurements that had been carried out in the 1990s at 35 measuring stations in groundwater reservoirs in Bavaria. The measuring points are distributed throughout the state, which provides a rare insight into the development of an entire region.

The geologists were able to show that almost all the groundwater reservoirs they investigated had warmed up in a similar way over the decades. “Climate change has a very clear effect at depths starting at around 15 metres; at that point short-term local or seasonal fluctuations can no longer be measured,” explains Hemmerle. The groundwater at depths of 20 metres was, on average, nearly 0.9 degrees Celsius warmer than in the 1990s. At depths of 60 metres it was still nearly 0.3 degrees warmer. During the same period, the average air temperature rose by 1.05 degrees Celsius.

“It can be assumed that the groundwater will warm up even more as a delayed reaction to air temperatures and that it will continue to react to rising atmospheric temperatures in the future,” says Hemmerle. The consequences of this warming are still difficult to gauge, says Bayer, who adds, higher water temperatures affect the growth of microbes and put pressure on underground ecosystems that are adapted to very constant temperatures.

In order to get a feel for the magnitude of the measurements, Bayer and Hemmerle also compared ground warming at a depth of 15 metres with Bavaria’s annual heating requirements. Their findings: the increase in temperature correlates to about ten percent of demand. “At least a portion of the heat could possibly be reused as geothermal energy,” says Bayer. However, the results cannot be directly transferred to the whole of Germany. “But it can be assumed that the trend is the same,” says Hemmerle.make a difference: sponsored opportunity


Story Source:

Materials provided by Martin-Luther-Universität Halle-Wittenberg. Note: Content may be edited for style and length.


Journal Reference:

  1. Hannes Hemmerle, Peter Bayer. Climate Change Yields Groundwater Warming in Bavaria, Germany. Frontiers in Earth Science, 2020; 8 DOI: 10.3389/feart.2020.575894

FOR MORE INFORMATION: Martin-Luther-Universität Halle-Wittenberg. “Climate change warms groundwater in Bavaria.” ScienceDaily. ScienceDaily, 1 December 2020. <www.sciencedaily.com/releases/2020/12/201201124124.htm>.

Ultrasensitive transistor for herbicide detection in water

Why Is Drinking Water Important? 6 Reasons to Stay Hydrated

A new polymer-based, solid-state transistor can more sensitively detect a weed killer in drinking water than existing hydrogel-based fluorescence sensor chips. The details were published in Chemistry-A European Journal.

The sensor is a specially designed organic thin-film transistor based on semiconducting molecules of carboxylate-functionalized polythiophene (P3CPT). What’s special about this particular device is that, unlike other conjugated polymer-based sensors, this one is a solid-state device that can conduct an electric current when placed inside a fluid.

The device, designed by Tsuyoshi Minami of The University of Tokyo’s Institute of Industrial Science and colleagues, works by adding copper ions, which bind to the P3CPT molecules. When the device is placed in water that contains even the smallest amount of the herbicide glyphosate, the copper ions leave the P3CPT molecules to attach to the glyphosate molecules. This causes a detectable reduction in the flow of electric current through the device. Glyphosate is a commonly used weed killer in agriculture, and there are concerns that its presence in drinking water can be harmful to human health.

The scientists found that the device was so sensitive that it could detect as low as 0.26 parts per million of glyphosate in drinking water. The team compared their new device to a conventional fluorescence sensor chip, which was only capable of detecting down to 0.95 parts per million of glyphosate. To put this into perspective, the maximum allowable amount of glyphosate in drinking water, according to the United States Environmental Protection Agency, is 0.7 parts per million.

The scientists believe that the sensitivity of their device boils down to interactions occurring within individual polymer molecules and between neighbouring ones. Commonly used fluorescence sensors depend solely on interactions occurring within individual molecules.

“Our device could be a novel solid-state platform for sensing target molecules in aqueous media,” says Minami. The researchers are currently working on further developing their polythiophene-based sensors.make a difference: sponsored opportunity


Story Source:

Materials provided by Institute of Industrial Science, The University of Tokyo. Note: Content may be edited for style and length.


Journal Reference:

  1. Yui Sasaki, Koichiro Asano, Tsukuru Minamiki, Zhoujie Zhang, Shin‐ya Takizawa, Riku Kubota, Tsuyoshi Minami. A Water‐Gated Organic Thin‐Film Transistor for Glyphosate Detection: A Comparative Study with Fluorescence Sensing. Chemistry – A European Journal, 2020; 26 (64): 14525 DOI: 10.1002/chem.202003529

FOR MORE INFORMATION: Institute of Industrial Science, The University of Tokyo. “Ultrasensitive transistor for herbicide detection in water.” ScienceDaily. ScienceDaily, 1 December 2020. <www.sciencedaily.com/releases/2020/12/201201124142.htm>.

Offshore submarine freshwater discovery raises hopes for islands worldwide

Offshore submarine freshwater discovery raises hopes for islands worldwide

Twice as much freshwater is stored offshore of Hawai’i Island than was previously thought, according to a University of Hawai’i study with important implications for volcanic islands around the world. An extensive reservoir of freshwater within the submarine southern flank of the Hualālai aquifer has been mapped by UH researchers with the Hawai’i EPSCoR ‘Ike Wai project. The groundbreaking findings, published in Science Advances, reveal a novel way in which substantial volumes of freshwater are transported from onshore to offshore submarine aquifers along the coast of Hawai’i Island.

This mechanism may provide alternative renewable resources of freshwater to volcanic islands worldwide. “Their evidence for separate freshwater lenses, stacked one above the other, near the Kona coast of Hawai’i, profoundly improves the prospects for sustainable development on volcanic islands,” said UH Manoa School of Ocean and Earth Science and Technology (SOEST) Dean Brian Taylor.

Paradigm shift

Through the use of marine controlled-source electromagnetic imaging, the study revealed the onshore-to-offshore movement of freshwater through a multilayer formation of basalts embedded between layers of ash and soil, diverging from previous groundwater models of this area. Conducted as a part of the National Science Foundation-supported ‘Ike Wai project, research affiliate faculty Eric Attias led the marine geophysics campaign.

“Our findings provide a paradigm shift from the conventional hydrologic conceptual models that have been vastly used by multiple studies and water organizations in Hawai’i and other volcanic islands to calculate sustainable yields and aquifer storage for the past 30 years,” said Attias. “We hope that our discovery will enhance future hydrologic models, and consequently, the availability of clean freshwater in volcanic islands.”

Co-author Steven Constable, a professor of geophysics at the Scripps Institution of Oceanography, who developed the controlled source electromagnetic system used in the project, said, “I have spent my entire career developing marine electromagnetic methods such as the one used here. It is really gratifying to see the equipment being used for such an impactful and important application. Electrical methods have long been used to study groundwater on land, and so it makes sense to extend the application offshore.”

Kerry Key, an associate professor at Columbia University who employs electromagnetic methods to image various oceanic Earth structures, who not involved in this study, said, “This new electromagnetic technique is a game changing tool for cost-effective reconnaissance surveys to identify regions containing freshwater aquifers, prior to more expensive drilling efforts to directly sample the pore waters. It can also be used to map the lateral extent of any aquifers already identified in isolated boreholes.”

Two-times more water

Donald Thomas, a geochemist with the Hawai’i Institute of Geophysics and Planetology in SOEST who also worked on the study, said the findings confirm two-times the presence of much larger quantities of stored groundwater than previously thought.

“Understanding this new mechanism for groundwater…is important to better manage groundwater resources in Hawai’i,” said Thomas, who leads the Humuʻula Groundwater Research project, which found another large freshwater supply on Hawai’i Island several years ago.

Offshore freshwater systems similar to those flanking the Hualālai aquifer are suggested to be present for the island of O’ahu, where the electromagnetic imaging technique has not yet been applied, but, if demonstrated, could provide an overall new concept to manage freshwater resources.

The study proposes that this newly discovered transport mechanism may be the governing mechanism in other volcanic islands. With offshore reservoirs considered more resilient to climate change-driven droughts, volcanic islands worldwide can potentially consider these resources in their water management strategies.

This project is supported by the National Science Foundation EPSCoR Program Award OIA #1557349.make a difference: sponsored opportunity


Story Source:

Materials provided by University of Hawaii at Manoa. Note: Content may be edited for style and length.


Journal Reference:

  1. Eric Attias, Donald Thomas, Dallas Sherman, Khaira Ismail and Steven Constable. Marine electrical imaging reveals novel freshwater transport mechanism in Hawai‘i. Science Advances, 2020 DOI: 10.1126/sciadv.abd4866

FOR MORE INFORMATION: University of Hawaii at Manoa. “Offshore submarine freshwater discovery raises hopes for islands worldwide.” ScienceDaily. ScienceDaily, 25 November 2020. <www.sciencedaily.com/releases/2020/11/201125154829.htm>.

Climate change presents new challenges for the drinking water supply

Climate change presents new challenges for the drinking water supply |  EurekAlert! Science News

The Rappbode Reservoir in the Harz region is Germany’s largest drinking water reservoir, supplying around one million people with drinking water in areas including the Halle region and the southern part of the state of Saxony-Anhalt. Water temperatures in the reservoir now have the potential to increase significantly due to climate change. If average global warming reaches between 4 and 6 degrees by the year 2100, as the current trend suggests, temperature conditions in the Rappbode Reservoir will become comparable to those in Lake Garda and other lakes south of the Alps. In an article in Science of the Total Environment magazine, a team of researchers led by the Helmholtz Centre for Environmental Research (UFZ) writes that the reservoir’s operators could partially offset the impacts this will have on the drinking water supply — to do so, they would have to change the way the reservoir is managed.

The impacts of climate change can already be seen in the Rappbode Reservoir: Over the past 40 years, the water surface temperature in the reservoir has increased by around 4 degrees in the summer months. This trend could continue, as has now been demonstrated by a team of researchers led by Dr Karsten Rinke, who researches lakes at UFZ. Working on the basis of a lake model developed by US researchers, the team took into account potential reservoir management strategies to forecast the impacts climate change could have on water temperatures and on the lake’s physical structure, which control the stratification and seasonal mixing of the body of water. Their research looked at three scenarios for future greenhouse gas emissions. The so-called “representative concentration pathways” (RCPs) describe whether greenhouse gas emissions will be halted (RCP 2.6), will continue to rise (RCP 6.0) or even continue to increase unabated (RCP 8.5) by 2100. According to the Intergovernmental Panel on Climate Change IPCC, the latter case would result in average global warming of more than 4 degrees by the end of this century.

For the RCP 2.6 and RCP 6.0 scenarios, the study’s authors projected that the average temperature on the water surface of the Rappbode Reservoir is set to increase by 0.09 degrees or 0.32 degrees respectively every decade by the year 2100. This would correspond to a total increase of around 0.7 degrees (RCP 2.6) and around 2.6 degrees (RCP 6.0) by the end of this century. As expected, the increase in temperatures would be the highest under the RCP 8.5 scenario, which would see the water temperature increasing by 0.5 degrees every decade or approx. 4 degrees by 2100.

However, in terms of using drinking water, what happens in the deeper strata of the reservoir — i.e., at depths of 50 metres and below — is more serious, as this is where raw water is taken out before being treated to prepare it as drinking water. It is true that impacts by 2100 would be relatively minor under the RCP 2.6 and RCP 6.0 scenarios, as the water temperature would continue to be around 5 degrees year-round. However, water temperatures will increase significantly under the RCP 8.5 scenario — by nearly 3 degrees by the end of the century. As a result, the water in the depths of the reservoir would warm to around 8 degrees. “This would turn a reservoir in Germany’s northernmost highlands into a body of water comparable to Lake Maggiore or Lake Garda nowadays,” says UFZ scientist Rinke. An increase of this magnitude would have consequences because it would significantly accelerate the speed of biological metabolic processes. “A temperature increase to 8 degrees nearly doubles oxygen demand, that is the amount of oxygen organisms consume during their respiration and degradation processes,” says lead author Chenxi Mi, who is focusing on climate impacts on the Rappbode Reservoir in his doctorate at UFZ. Increased oxygen consumption will place an additional pressure on the water’s oxygen budget, because the duration of summer stagnation — the phase of stable temperature stratification in lakes in which the deep water is closed off to oxygen supply from the atmosphere — is already extending due to climate change. Plus, warmer water is also unable to absorb as much oxygen. Potential consequences include intensified dissolution of nutrients and dissolved metals from the sediment, algae growth and an increase in blue-green algae.

In other words, the 8.5 scenario would have impacts on the drinking water supply if it were to occur. The reservoir’s operators draw the raw water from the lowermost strata for good reason, as the water there is cold and contains only low levels of suspended substances, dissolved metals, algae, bacteria and potentially pathogenic microorganisms. If the oxygen content there decreases more rapidly due to the rising water temperature, the risk of contamination increases, for example due to substances released from the sediment and greater bacteria growth. Treating the water would therefore require a greater effort on the part of the operators, and they would have to deal with higher demands in terms of the treatment capacity they would need to reserve. “This means preventing the deep water from warming is also worthwhile from the perspective of the drinking water supply, and the ideal way to do this is ambitious climate policies that limit warming,” says Rinke.

But the operators are not completely powerless against the warming of the deep water in the reservoir. The model simulations set up by Rinke’s team show that a share of the heat can be exported by using a clever system to withdraw the water. This has to do with the water that is released to the downstream waters that is, the water that is withdrawn and drains into the water course below the reservoir in order to keep the discharge conditions there stable. This so-called downstream discharge would need to be withdrawn not from the lower strata as it has been thus far but rather from near the surface. “This approach would allow the additional heat caused by climate change to be released again,” Rinke explains. However, he adds, it would be impossible to prevent the deep water from heating up if the air temperature increases beyond 6 degrees. “Even though operators have had to cope more with a shortage of water due to the very dry years we’ve had recently, it’s just as important to think about the quality of the water. In terms of reservoir management, we definitely have options and can respond to new conditions caused by climate change. In this way, we can alleviate certain negative impacts through climate adaptation measures.”

The operators of the Rappbode Reservoir at the Talsperrenbetrieb Sachsen-Anhalt company are aware of this. They have been working closely together with Karsten Rinke and his team of researchers at UFZ for many years to assess the impacts of climate change and discussed about potential options for adapting the Rappbode Reservoir. The Talsperrenbetrieb is already planning new infrastructures that will make it possible to implement the new management strategies.make a difference: sponsored opportunity


Story Source:

Materials provided by Helmholtz Centre for Environmental Research – UFZ. Note: Content may be edited for style and length.


Journal Reference:

  1. Chenxi Mi, Tom Shatwell, Jun Ma, Yaqian Xu, Fangli Su, Karsten Rinke. Ensemble warming projections in Germany’s largest drinking water reservoir and potential adaptation strategies. Science of The Total Environment, 2020; 748: 141366 DOI: 10.1016/j.scitotenv.2020.141366

FOR MORE INFORMATION: Helmholtz Centre for Environmental Research – UFZ. “Climate change presents new challenges for the drinking water supply.” ScienceDaily. ScienceDaily, 23 November 2020. <www.sciencedaily.com/releases/2020/11/201123112457.htm>.

Predicting urban water needs

Urban water management - Ramboll Group

The gateway to more informed water use and better urban planning in your city could already be bookmarked on your computer. A new Stanford University study identifies residential water use and conservation trends by analyzing housing information available from the prominent real estate website Zillow.

The research, published Nov. 18 in Environmental Research Letters, is the first to demonstrate how new real estate data platforms can be used to provide valuable water use insights for city housing and infrastructure planning, drought management and sustainability.

“Evolving development patterns can hold the key to our success in becoming more water-wise and building long-term water security,” said study senior author Newsha Ajami, director of urban water policy at Stanford’s Water in the West program. “Creating water-resilient cities under a changing climate is closely tied to how we can become more efficient in the way we use water as our population grows.”

It’s estimated that up to 68 percent of the world’s population will reside in urban or suburban areas by 2050. While city growth is a consistent trend, the types of residential dwellings being constructed and neighborhood configurations are less uniform, leading to varying ways in which people use water inside and outside their homes. The people living within these communities also have different water use behaviors based on factors such as age, ethnicity, education and income. However, when planning for infrastructure changes, decision-makers only take population, economic growth and budget into account, resulting in an incomplete picture of future demand. This, in turn, can lead to infrastructure changes, such as replacing old pipes, developing additional water supply sources or building wastewater treatment facilities, that fail to meet community needs.

Zillow and other real estate websites gather and publish records collected from different county and municipal agencies. These websites can also be updated by homeowners, making them rich sources of information that can otherwise be difficult and timely to obtain. The Stanford researchers used data from Zillow to gather single-family home information, including lot size, home value and number of rooms in Redwood City, California, a fast-growing, economically diverse city with various styles of houses, lots and neighborhoods. Then, they pulled U.S. Census Bureau demographic information for the city, looking at factors including average household size and income along with the percentage occupied by renters, non-families, college educated and seniors.

Coupling the Zillow and census data and then applying machine learning methods, the researchers were able to identify five community groupings, or clusters. They then compared the different group’s billing data from the city’s public works department to identify water usage trends and seasonal patterns from 2007 to 2017 and conservation rates during California’s historic drought from 2014 to 2017.

“With our methods incorporating Zillow data we were able to develop more accurate community groupings beyond simply clustering customers based on income and other socioeconomic qualities. This more granular view resulted in some unexpected findings and provided better insight into water-efficient communities,” said lead author Kim Quesnel, a postdoctoral scholar at the Bill Lane Center for the American West while performing the research.

They found the two lowest income groups scored average on water use despite having a higher number of people living in each household. The middle-income group had high outdoor water use but ranked low in winter water use, signaling efficient indoor water appliances — such as low-flow, high-efficiency faucets and toilets — making them an ideal target for outdoor conservation features such as converting green spaces or upgrading to weather-based or smart irrigation controllers.

The two highest income groups, characterized by highly educated homeowners living in comparatively larger homes, were the most dissimilar. One cluster — younger residents on smaller lots with newer homes in dense, compact developments — had the lowest water use of the entire city. The other high-income cluster consisting of older houses built on larger lots with fewer people turned out to be the biggest water consumer. The finding goes against most previous research linking income and water use, and suggests that changing how communities are built and developed can also change water use patterns, even for the most affluent customers.

All groups showed high rates of water conservation during drought. Groups with the highest amount of savings (up to 37 percent during peak drought awareness) were the two thirstiest consumers (the high-income, large-lot and middle-income groups) demonstrating high potential for outdoor water conservation. Groups with lower normal water usage were also able to cut back, but were more limited in their savings. Understanding these limitations could inform how policymakers and city planners target customers when implementing water restrictions or offering incentives such as rebates during drought.

This research lays the framework for integrating big data into urban planning, providing more accurate water use expectations for different community configurations. Further studies could include examining how data from emerging online real estate platforms can be used to develop neighborhood water use classifications across city, county or even state lines. An additional area of interest for the researchers is examining how water use consumption is linked to development patterns in other kinds of residential areas, for example in dense cities.

“Emerging, accessible data sources are giving us a chance to develop a more informed understanding of water use patterns and behaviors,” said Ajami. “If we rethink the way we build future cities and design infrastructure, we have the opportunity for more equitable and affordable access to water across various communities.”make a difference: sponsored opportunity


Story Source:

Materials provided by Stanford University. Original written by Michelle Horton. Note: Content may be edited for style and length.


Journal Reference:

  1. Kimberly J Quesnel, Saahil Agrawal, Newsha K Ajami. Diverse paradigms of residential development inform water use and drought-related conservation behavior. Environmental Research Letters, 2020; 15 (12): 124009 DOI: 10.1088/1748-9326/abb7ae

FOR MORE INFORMATION: Stanford University. “Predicting urban water needs.” ScienceDaily. ScienceDaily, 18 November 2020. <www.sciencedaily.com/releases/2020/11/201118080752.htm>.