The first global-scale assessment of the role ecosystems play in providing sanitation finds that nature provides at least 18% of sanitation services in 48 cities worldwide, according to researchers in the United Kingdom and India. The study, published February 19 in the journal One Earth, estimates that more than 2 million cubic meters of the cities’ human waste is processed each year without engineered infrastructure. This includes pit latrine waste that gradually filters through the soil — a natural process that cleans it before it reaches groundwater.
“Nature can, and does, take the role of sanitation infrastructure,” said Alison Parker, a Senior Lecturer in International Water and Sanitation at Cranfield University in the United Kingdom and one of the authors of the study. “While we are not marginalizing the vital role of engineered infrastructure, we believe a better understanding of how engineered and natural infrastructure interact may allow adaptive design and management, reducing costs, and improving effectiveness and sustainability, and safeguard the continued existence of these areas of land.”
Wastewater treatment infrastructure that converts human feces into harmless products is an important tool for global human health. However, more than 25% of the world’s population did not have access to basic sanitation facilities in 2017 and another 14% used toilets in which waste was disposed of onsite. While some of this waste may be hazardous to local populations, previous research has suggested that natural wetlands and mangroves, for example, provide effective treatment services. The Navikubo wetland in Uganda processes untreated wastewater from more than 100,000 households, protecting the Murchison Bay and Lake Victoria from harmful contaminants, while in the United States coastal wetlands in the Gulf of Mexico remove nitrogen from the Mississippi River.
“We realized that nature must be providing sanitation services, because so many people in the world do not have access to engineered infrastructure like sewers,” adds Simon Willcock, a Senior Lecturer in Environmental Geography in Bangor University, UK, and another author of the study. “But the role for nature was largely unrecognized.”
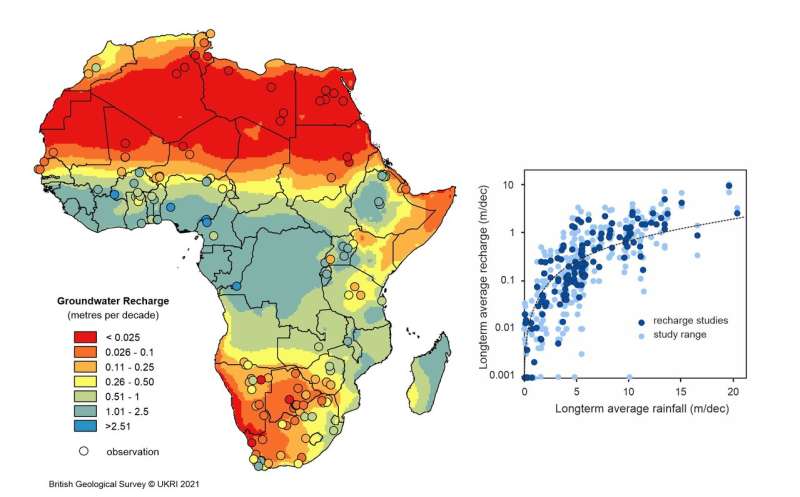
To better understand how natural ecosystems process waste, the team from Bangor University, Cranfield University, Durham University, University of Gloucestershire, University of Hyderabad (India) and the Fresh Water Action Network, South Asia quantified sanitation ecosystem services in 48 cities containing about 82 million people using Excreta Flow Diagrams, which leverage a combination of in-person interviews, informal and formal observations, and direct field measurements to document how human fecal matter flows through a city or town. The researchers assessed all diagrams that were available on December 17th, 2018, focusing on those coded as “fecal sludge contained not emptied” (FSCNE), in which the waste is contained in a pit latrine or septic tank below ground but does not pose a risk to groundwater, for example, because the water table is too deep.
Conservatively, Willcock and colleagues estimate that nature processes 2.2 million cubic meters of human waste per year within these 48 cities. Since more than 892 million people worldwide use similar onsite disposal toilet facilities, they further estimate that nature sanitizes about 41.7 million tons of human waste per year before the liquid enters the groundwater — a service worth about $4.4 billion per year. However, the authors note that these estimates likely undervalue the true worth of sanitation ecosystem services, since natural processes may contribute to other forms of wastewater processing, though these are harder to quantify.
Willcock and colleagues hope that their findings will shed light on an important but often unrecognized contribution that nature makes to many people’s everyday lives, inspiring the protection of ecosystems such as wetlands that protect downstream communities from wastewater pollutants.
“We would like to promote a better collaboration between ecologists, sanitation practitioners and city planners to help nature and infrastructure work better in harmony, and to protect nature where it is providing sanitation services,” said Parker.
This work was prepared as part of the ESRC and ICSSR funded Rurality as a vehicle for Urban Sanitation Transformation (RUST) project.
Journal Reference:
- Willcock et al. Nature provides valuable sanitation services. One Earth, 2021 DOI: 10.1016/j.oneear.2021.01.003
FOR MORE INFORMATION: Cell Press. “Global study of 48 cities finds nature sanitizes 41.7 million tons of human waste a year.” ScienceDaily. ScienceDaily, 19 February 2021. <www.sciencedaily.com/releases/2021/02/210219111503.htm>.