The Merced River is seen flowing downstream through Briceburg, California, U.S. February 15, 2023
YOSEMITE NATIONAL PARK, California (Reuters) – After a winter of epic storms in California, Yosemite National Park’s famous waterfalls are in full flow, its reservoirs are brimming, and the snowpack in the surrounding Sierra Nevada Mountains is well above average.
In drought-stricken California, that is cause for celebration, but wildlife experts warn that weather extremes driven by climate change can also change habitats too quickly for wildlife to adapt.
“These extremes really take a toll on both the landscape, the wildlife and us,” Beth Pratt, California regional director for the National Wildlife Federation, told Reuters.
Pratt has been studying Yosemite Valley wildlife for 25 years, including the more than 400 species of vertebrates that call the 1,200 square-mile (3,100 square-kilometer) park home.
One of the smaller residents Pratt surveys is the native California Newt, a small orange salamander with rough, grainy skin. In 2022, Pratt was concerned that low water levels in the Merced River, which flows through the park, would dry up seasonal ponds where the newts lay their eggs. This year, that concern has been washed away – she spotted some newts on a recent visit.
However, after a spate of deadly “atmospheric river” storms that unleashed widespread flooding, triggered mudslides and killed at least 20 people, her worry is that too much water is disrupting their ecosystem.
“When you have a six-week period where they’re happening daily, the wildlife can’t shift their habitat that quickly,” she said. The storms also will not end California’s historic drought as virtually none of the storms reached the key Colorado River basin.
In his 27 years as a Yosemite park ranger, Scott Gediman has never seen so much winter snow and water in the park.
As well as delighting Yosemite visitors with thundering waterfalls, the deluge led to a bumper snowpack in the Sierra Nevada mountains, sometimes referred to as California’s “frozen reservoir.”
According to a California Department of Water Resources manual survey conducted on Feb. 1, statewide snowpack was almost double the average for the time of year. The snowpack supplies around 30% of California’s water needs.
“We kind of look at it like a bank,” Gediman said. “You bank all the snow up in the high country and then in the warm weather, the water comes down.”
But climate change means climate extremes, and as California experiences more severe droughts and heat waves, its occasional wet years are expected to be excessively rainy.
“Climate change isn’t something we’re waiting for,” Pratt said. “We’re experiencing it here, especially in the Sierra Nevada in California, we’re ground zero, just because of our Mediterranean climate.”
Mediterranean climates with rainy winters and dry, hot summers are particularly vulnerable to climate change.
“We don’t want people to come to Yosemite and not see Yosemite Falls in future years because we have no snowpack because of climate change,” Pratt said. “We want to preserve these places for both ourselves and the future. And climate is slowly destroying even the best protected places on the planet.”
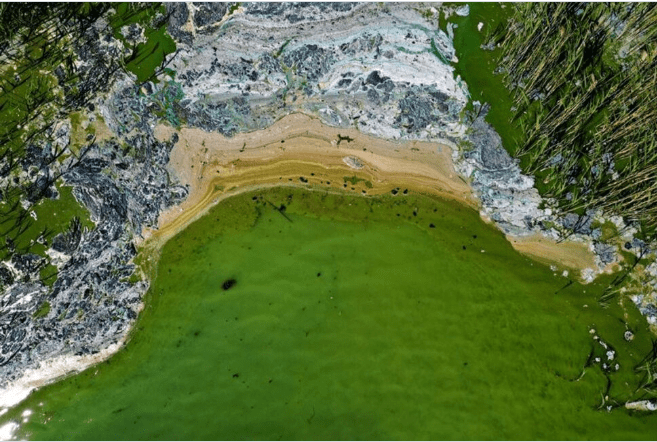
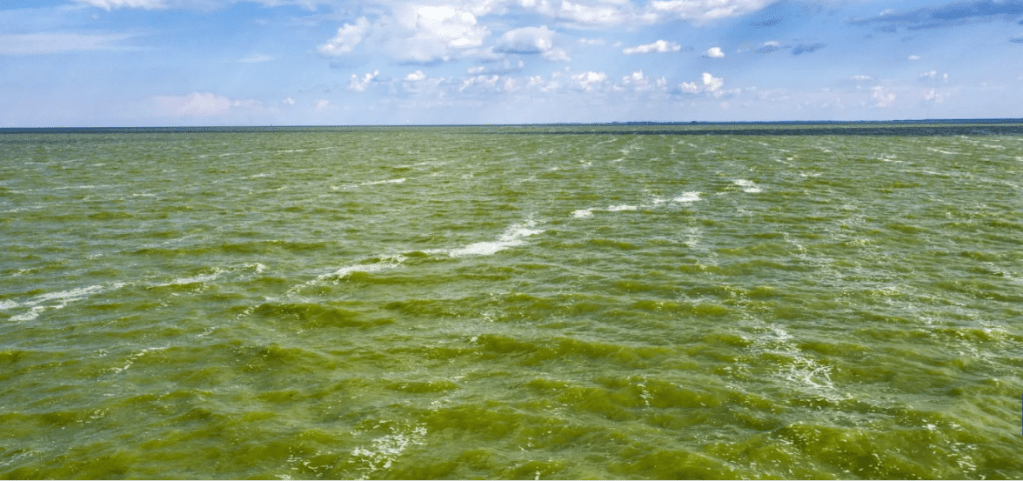
An aerial view of toxic blue-green algae bloom on the Baltic Sea coast at Tyreso near Stockholm, Sweden, June 25, 2020
LONDON (Reuters) – Huge blooms of phytoplankton — microscopic algae floating on the ocean’s surface — have become larger and more frequent along the world’s coastlines, according to new research, bringing benefits to fisheries but also potentially causing harm.
Between 2003 and 2020, coastal phytoplankton blooms increased by about 13% in extent, covering an additional 4 million square kilometres of the global ocean, the Nature study found. And the blooms occurred more often, up by 59% during that period.
While marine animals such as fish and whales eat phytoplankton, it can also prove toxic in large amounts, starving the ocean of oxygen and leading to “dead zones” that wreak chaos on the food chain and fisheries. A 2016 algal bloom near Chile, for example, cost salmon farms $800 million.
“Phytoplankton blooms can be really beneficial,” said study co-author Don Anderson who leads the U.S. National Office for Harmful Algal Blooms at Woods Hole Oceanographic Institution. “Many of the really productive fisheries in the world’s ocean are driven by blooms. It’s important to understand why they might be changing.”
Scientists used satellite observations to look for blooms, programming a system to pick up the colour of the algae. However, they weren’t able to distinguish between benign and harmful blooms.
While some regions saw weaker blooms over the past two decades, including the California Current, blooms strengthened in the northern Gulf of Mexico and the East and South China Seas.
BEHIND THE BOOM
What’s driving the increase in phytoplankton blooms varies by region, scientists said. In some cases, warmer sea surface temperatures appear to be behind the boom. Changes in climate can also mess with ocean circulation, affecting mixing between ocean layers and how nutrients move around the ocean.
Human development also plays a role. Fertilizer runoff from agriculture can spike nutrient loads in the ocean, leading to blooms. Researchers also found that more aquaculutre around places like Finland, China, and Vietnam might be associated with more algal blooms.
Outside of fertilizer use and aquaculutre, “I would also be interested in relationships between population increases along coastal areas and bloom increase,” said Nandita Basu, a Canada Research Chair in Global Water Sustainability and Ecohydrology not affiliated with the study. “This would be especially relevant for some countries in the southern hemisphere where a major part of the domestic waste is not treated.”
Raw water contains microscopic pathogens that are too small to remove during water and wastewater treatment easily. Chemicals are added to form large clumps called flocs, which are easily filtered out. Flocculation is the process used in water treatment to remove suspended particles from the water.
“Coagulant chemicals need to be added to purify drinking water and remove turbidity (cloudiness) and microbes that are too small to be visible to the naked eye,” said Dr. Kuang-An Chang, professor in the Zachry Department of Civil and Environmental Engineering at Texas A&M.
But it is crucial to properly mix the water and chemicals so the pathogens properly clump. If mixing is low, clumps won’t form. If mixing is too intense, clumps will form but quickly break apart.
The new method simultaneously monitors the size and shape of the clumps and the mixing intensity in a single step, in real time, allowing for more accurate measurements. The value of the research lies in the fact that mixing is one of the most energy-consuming processes during water and wastewater purification.
The results of this study were recently published in the journal ACS ES&T Engineering and featured on the cover of its February issue.
“We developed a brand-new technique to non-intrusively monitor the mixing so that we can precisely control it, quantify heterogeneities within the reactor and potentially optimize it to create flocs of desired characteristics while simultaneously minimizing energy consumption,” he said.
This first-of-its-kind technique can be used to improve flocculation, meaning successfully removing contaminants by growing large enough clumps while minimizing the energy used.
“All previous research did this in two steps,” Chang said. “In the old approach, first, artificial particles of known characteristics would be added to monitor mixing. Then, a second experiment would be done with ‘identical’ settings and the actual clumps would be monitored.
“We essentially halved the workload and improved precision because there are always statistical differences any time you do two experiments.”
This interdisciplinary project was a collaboration between Chang, who focuses on fluid dynamics, and Dr. Shankar Chellam, professor of civil and environmental engineering and A.P. and Florence Wiley Professor III, who focuses on water/wastewater treatment.
Three graduate students performed the experimental work and associated numerical analysis: Kaleisha Miller, Kyungho Kim and Wei-Liang Chuang, who is now an assistant professor at National Sun Yat-sen University in Taiwan.
“Forever chemicals” are everywhere — water, soil, crops, animals, the blood of 97% of Americans — researchers from Drexel University’s College of Engineering are trying to figure out how they got there. Their recent findings suggest that the microbes that help break down biodegradable materials and other waste are likely complicit in the release of the notorious per- and polyfluoroalkyl substances (PFAS) into the environment.
In a paper published in the Royal Society of Chemistry journal Environmental Science Processes & Impacts, the group showed how PFAS — chemicals that had been widely used in water, heat and stain-resistant products and have been linked to serious health problems — can leach out of fertilizer made from recycled waste with the help of microbial decomposition. The finding could help to explain how PFAS accumulates in the soil, crops and groundwater in farmland across the country.
“Because it is not currently possible to eliminate PFAS from the environment, it’s important to understand everything we can about how it is able to persist and accumulate so broadly in the natural world,” said co-author Asa Lewis, PhD, who led the research as a doctoral student at Drexel along with environmental engineers from Temple University. “Our work shows how microbial weathering fits into the PFAS dissemination pathway from biosolids.”
According to the Environmental Protection Agency, about half of all sewage waste in the U.S. — about 4.5 million metric tons — is treated and converted to a sludge, called biosolid waste. About half of that goes through further treatment to remove biological and chemical contaminants and is converted into a fertilizer product. For the last 50 years, this fertilizer has been used throughout the country on farmland, residential gardens and landscaping.
But research in the last year raised concerns about this widespread use when it revealed that PFAS can persist in biosolid fertilizer, despite the treatment process.
“We know that microbes exist in biosolid sludge even after the stabilization treatment process and given the role they play in the decomposition of organic compounds, such as fats, protein, and polysaccharide residuals in the biosolids, we wanted to examine how microbial weathering of these organic compounds can impact PFAS leaching potential from biosolids over time because it PFAS compounds are thought to stick to these compounds,” said Christopher Sales, PhD, an associate professor in the College of Engineering and a co-author of the study.
To do it, the team collected biosolid samples that had undergone one of three types of treatment — aerobic digestion, anaerobic digestion or composting — at wastewater recycling and reuse facilities. The content of each sample was tested to determine the initial level of organic matter, proteins and lipids and PFAS concentration in these different types of biosolids. These samples were then placed in an environmentally controlled chamber for three months to look for indicators of microbial activity, especially degradation of organics, lipids and proteins, and sought to see how this microbial activity affected how much PFAS would partition from the biosolids into water.
The researchers found that the samples with the highest level of microbial activity also demonstrated the highest level of PFAS partitioning — an indicator that this biosolid sludge would be more susceptible to PFAS leaching.
The results demonstrated this increase in PFAS partitioning over the three months, especially in the first 10 days of the experiment, is likely due to the microbes breaking down proteins and lipids in the biosolid, which allows the PFAS to spread, or partition, as water passes through.
“This work provides evidence that microbial weathering processes that lead to degradation of organic matter and biopolymers — as indicated by lipase activity, protease activity, and oxygen consumption rate, as well as changes in lipid, protein, and organic content — can impact PFAS partitioning and increase leaching potential in biosolids,” the authors wrote.
The team noted that the results likely implicate microbes in the process of PFAS leaching from biosolids after they are land-applied, but further research is needed to confirm how they are transported through the soils to surface waters, like rivers and lakes, groundwaters and how they bioaccumulate in crops and animals that might graze where biosolids are applied. In addition, the rate of biosolid weathering in nature might be much different than their lab study considering the role that rainfall, solar irradiation, and physical disturbances impact soil weathering would play outdoors.
The team contends that in order for agencies like the EPA to provide accurate guidance on PFAS risk and acceptable levels of contamination, understanding the path of “forever chemicals” is critical information.
“This research provides evidence that PFAS can leach from biosolids across different stabilization methods in wastewater treatment,” Lewis said. “And it provides more support that regulation or advanced treatment in wastewater treatment plants is needed to reduce impacts to the environment.”
Billions in clean energy incentives rely on raw materials from polluting corn and livestock.
By Keith Schneider Circle of Blue
February 8, 2023
President Biden, U.S. environmental organizations, and climate activists were appropriately enthused last summer when Democrats passed the Inflation Reduction Act.
Embedded in the new statute are more than $140 billion in direct payments and tax incentives for renewable fuels and cleaner electrical generation to help reduce greenhouse gas emissions 40 percent below 2005 levels by the end of the decade. The statute also includes $19.5 billion for the Department of Agriculture’s new “climate smart” crop production practices.
In the give and take of opinion about the climate provisions of the Inflation Reduction Act, the consensus is that the social benefits of curbing the Earth’s warming easily exceed the financial and social costs.
Yet viewed from the frontlines of a water quality emergency that has unfolded in the Heartland, the consensus dissolves in provisions that appear certain to increase the already immense tide of farm-related nutrient pollution draining from the land and contaminating surface and groundwater, especially in the grain, dairy, and meat-producing regions of the Great Lakes states and the Midwest Corn Belt.
Farming-related contaminants already pollute thousands of drinking water wells from Minnesota to Missouri, and virtually every mile of streams and rivers in Iowa is impaired with little regulation to rein in the pollutants. “It’s already a national emergency and a national scandal,” said Emma Schmit, a senior organizer in the Midwest for Food and Water Watch, an environmental advocacy group. “When we test our waterways, the main pollutants are E.coli and nitrates and phosphorus from agriculture. These are pathogens and contaminants that can cause serious issues for people. We’re about to give large corporate farms carte blanche to make it worse.”
How is it possible that legislation billed as an environmental protection statute ends up as a primary threat to clean water and communities? The answer is this: The law relies on raw materials from two of the most polluting industries in America – corn production, and industrialized livestock operations that fatten millions of beef cattle, cows, hogs, and chickens for consumer appetites.
Among the most costly provisions of the Inflation Reduction Act are practices that support three key agricultural efforts: The production of more ethanol from corn; the capture of carbon dioxide, especially from ethanol refineries; and moves to produce electricity and transportation fuel from methane by capturing emissions from manure digesters installed at massive livestock and poultry operations.
In effect, those provisions of the Inflation Reduction Act put agriculture in a place it’s been slowly approaching for decades: at the very center of the nation’s industrial policy for developing energy for electrical generation and transportation.
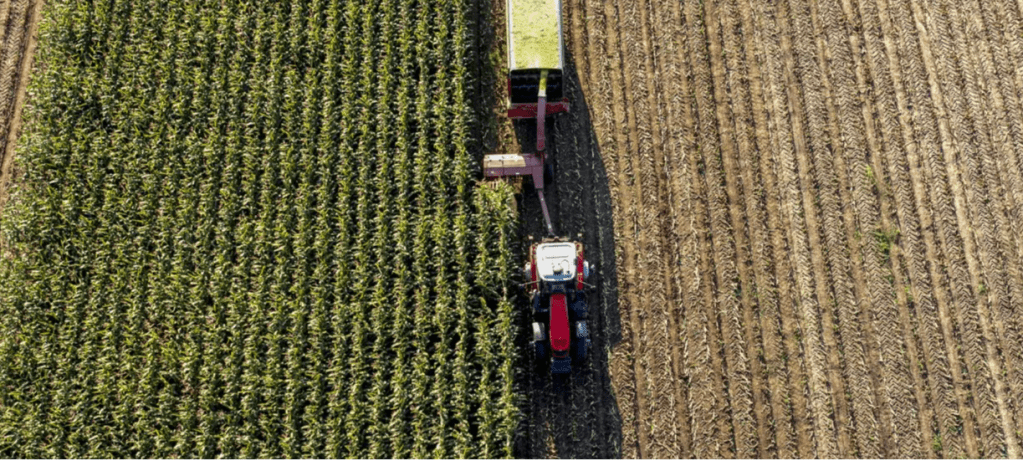
The incentive for more corn production is particularly worrisome as farmers typically make heavy use of nitrogen fertilizers when growing corn, said Chris Jones, a research engineer and water quality specialist at the University of Iowa.
“Anytime we incentivize production of a nutrient hungry crop you’re going to get nutrient pollution,” Jones said. “Corn loses a lot of nutrients to the environment. We know that for a certainty. We’re incentivizing further production. We’re going to get more pollution. You don’t need to be a genius to know that.”
Corn is the most heavily fertilized row crop in America, accounting for 11 billion pounds of commercial nitrogen fertilizer applied to farmland annually, with 9 of the 11 billion pounds applied in the Midwest, according to the USDA. State and federal research shows that up to 70% of applied nitrogen is not taken up by the growing plant, and runs off the land and into streams, rivers, and groundwater.
Agricultural nutrient pollution is the primary reason that the Clean Water Act has not come close to meeting its “fishable and swimmable” goal for US surface waters.
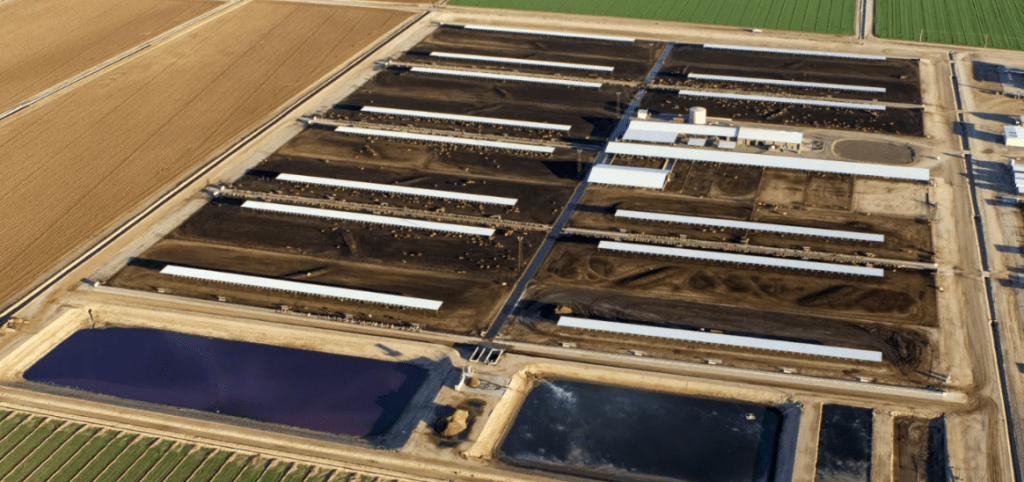
The law’s support for the expansion of cattle, large dairies, hog, and poultry feeding operations is equally as problematic.
The country’s large livestock operations, also primarily centered in the Midwest, produce hundreds of billions of gallons of untreated liquid manure and tens of millions of tons of solid manure that are spread with scant oversight on farmland. Manure contains nitrogen, phosphorus, and dangerous pathogens that drain from the land and contaminate waters at the center of the country.
In 2016, the U.S. Environmental Protection Agency identified phosphorus and nitrogen discharges from U.S. farmland as “the single greatest challenge to our nation’s water quality.” Because of waivers written into the Clean Water Act, which last year marked its 50th anniversary, nutrient runoff from farms and smaller livestock operations are completely unregulated. Large livestock operators, meanwhile, are given broad discretion by states for managing and spreading manure. Congress required no additional safeguards for water in the Inflation Reduction Act.
In other words, for millions of Americans in the Heartland already contending with dirty water, the new law will make the country’s most severe surface and groundwater pollution worse, according to water quality specialists. Probably a lot worse.
“It’s going to end up in the water,” Rebecca Ohrtman, a water quality specialist from Iowa, said of the contaminates from what are commonly called “confined animal feeding operations (CAFOs). Ohrtman spent much of her career as water protection coordinator with the Iowa Department of Natural Resources and the Iowa Department of Agriculture and Land Stewardship. “I can’t believe they’re going to provide all this funding with no strings attached.”
The U.S. Department of Agriculture did not respond to questions raised about the effects of the new statute on water pollution. Corn and livestock industry executives did not respond to interview requests.
In approving the Inflation Reduction Act, neither the Biden administration nor Congress wholly ignored the risk to water. The law enables the U.S.D.A. to fund its $19.5 billion climate smart program to “ improve soil carbon, reduce nitrogen losses, or reduce, capture, avoid, or sequester carbon dioxide, methane, or nitrous oxide emissions, associated with agricultural production.”
The statute also provides $18 billion for existing, decades old conservation programs. “The Inflation Reduction Act provides major incentives for a broad range of different practices and strategies for managing nutrients, guarding water quality, and keeping carbon in the soil,” Senator Debbie Stabenow, the Michigan Democrat and chairwoman of the Senate Agriculture Committee, said in an interview. “There are a lot of strategies that work but there are not enough farmers participating because there hasn’t been enough money to fund all the requests.”
Whether that is the case will be tested this year. The climate smart program includes the largest investment ever made by the federal government in environmentally-sensitive organic and sustainable farm practices. But that $300 million investment applies to just 19 projects in the Midwest, and a few thousand acres of the more than 100 million acres of cropland in the Corn Belt and Great Lakes States.
The bulk of the USDA “climate smart” and conservation programs support voluntary “best management practices” that include not plowing before planting, raising cover crops, and planting buffer strips to soak up excess nutrients. But best management practices, initially designed to control soil erosion, have displayed scant usefulness in reducing phosphorus in streams in the Great Lakes states.
These best management practices have never been especially popular with corn growers and livestock producers in the 9-state Corn Belt from the Dakotas to Missouri. Just 2.2 million of Iowa’s 30 million acres of farmland, for example, were planted in cover crops, according to the most recent analysis by the state Department of Agriculture.
Of much greater importance to crop and livestock producers are tax incentives directed at renewable fuels and carbon sequestration. The Biden administration proposes to increase ethanol production from 15 billion gallons currently to 21 billion gallons this year, and 23 billion gallons by 2025. In addition, the administration just released a national energy strategy that calls for ethanol to be a primary feedstock for producing 35 billion gallons of “sustainable” fuel by mid-century for the world’s airlines.
Though the $1.01 per gallon tax credit is a win for corn and ethanol producers, the administration’s plan for ethanol is a big problem for water. Basic arithmetic explains why. With contemporary crop yields it requires 360 million bushels of corn to produce 1 billion gallons of ethanol. Those bushels are raised on roughly 2 million acres.
Corn farmers generally apply 140 to 160 pounds of commercial nitrogen fertilizer per acre to corn for ethanol, or roughly 300 million pounds of nutrients per billion gallons of ethanol. Corn farmers already apply more than 4 billion pounds of nitrogen fertilizer to produce the current national supply of ethanol.
Five billion more gallons of ethanol equates to applying 1.5 billion more pounds of fertilizer to 10 million more acres of cropland in corn-growing states. And more than half will drain and leach from the land into the water.
Another feature of the Inflation Reduction Act is a flurry of tax incentives to generate renewable energy from biodigesters. Essentially they are big tanks, like those seen at gasoline tank farms, that with the help of bacteria and heat convert organic wastes to methane.
Swimming in rivers, creeks and lakes can be a fun way to cool off in summer. But contamination in natural waterways can pose a risk to human health.
Waterborne pathogens can cause acute gastrointestinal illnesses such as diarrhea and vomiting. Other common illnesses include skin rashes, respiratory problems, and eye and ear infections.
Unfortunately, it can be hard to find out if a waterway in Australia is safe for recreation. By contrast, a comprehensive system in Aotearoa-New Zealand, called Can I Swim Here?, provides timely water quality information for 800 beach, river and lake sites.
We have investigated the benefits and barriers associated with opening up waterways for recreation. Unsurprisingly, ensuring a local swimming site is safe is key to getting people using it. That includes giving people access to accurate information about water quality.
Can swimming really make you sick?
Contaminated water can exist in swimming pools and spas, as well as oceans, lakes, and rivers, exposing humans to a range of pathogens.
According to official advice in New South Wales, common waterborne pathogens include:
enteric bacteria such as Escherichia coli (E.coli) or Enterococci, that live in the intestinal tracts of all warm-blooded animals and can enter water as fecal matter (or poo). They can cause gastroenteritis, skin and ear infections and dysentery
viruses such as noroviruses and hepatitis. They can cause diarrhea, vomiting, hepatitis and respiratory disease
protozoa such as giardia which, once ingested, can live as parasites in humans and animals and cause diarrhea.
Australian research has documented a link between gastroenteritis and people swimming in public pools and freshwater sites such as rivers, lakes and dams.
Other water quality hazards for swimming include toxic blue-green algae and exposure to chemical pollutants.
Recent floods in Australia have led to an elevated risk of water contamination. As others have noted, flood waters can be highly polluted with disease-causing organisms, including from sewerage overflows.
So how do swimming locations get contaminated? Pollution can come from untreated sewage, or runoff containing animal poo or fertilizers. The source could be chemicals from nearby industrial activities, or the water users themselves.
Thankfully, most disease outbreaks from swimming are not fatal. An exception is the amoeba Naegleria fowleri. It lives in warmer waters and can cause amoebic meningitis, a potentially fatal brain disease.
How safe is your local swimming hole?
In Australia, guidance on recreational water quality tends to focus on ocean beaches. For example, NSW’s Beachwatchprogram cover more than 200 NSW coastal (and some estuary) beaches. The advice is based on likelihood of rain combined with testing swimming sites for fecal bacteria.
The Victorian government also provides coastal swimming guidance for 36 beaches in Port Phillip Bay.
But away from the coast, information on the water quality of our local rivers, creeks and lakes, is sparse.
In NSW, advice exists for swimming and boating at four sites on the Nepean River in Western Sydney. Information is provided for a recently reopened swimming site at Lake Parramatta and for swimming at some Blue Mountains sites.
In Victoria, the Yarra Watch program monitors four swimming sites in freshwater stretches of the Yarra River, upstream of Melbourne.
And authorities in Canberra provide regular water quality monitoring and swimming advice for lakes and rivers.
But in contrast to Australia, New Zealand provides far more detailed and broad guidance.
How New Zealand does it
New Zealand’s world-leading national program Can I swim here? enables people to find the best places to swim across 800 beach, river and lake sites across the country.
The advice is provided by LAWA (Land, Air, Water Aotearoa), a collaboration between regional councils, the New Zealand government, scientific experts and academics, and a philanthropist organization.
The data available includes both the latest weekly water quality test results, and results dating back five years.
The guidance also includes an interactive map (see above) where users can zoom to swimming sites in their region.
More work is needed
Everyone loves to be around, on and in the water, especially during summer. As well as providing a way to cool down, local swimming holes are great places for people to socialize, exercise and engage with nature—especially for those not near a beach.
Governments are recognizing the real opportunity to open up underused waterways for recreation across Australia. But for the sake of our communities, more work is needed on improving water quality and sharing information.
Australia has a lot to learn from New Zealand and other countries on how to manage our waterways for recreational use. And ongoing research, partnering with government and industry, is clearly needed.
While residents in California are still dealing with damage from last month’s floods—after years of devastating droughts—UBC Okanagan engineers are looking at better ways to manage the delivery of safe drinking water to homes.
Their research was conducted in the School of Engineering’s Life Cycle Management Lab in collaboration with Universite Laval. It was published in the January edition of the Journal of Environmental Management.
Things to consider include a changing climate, costs and sustainability.
Dr. Haroon Mian, a Postdoctoral Research Associate with UBCO’s School of Engineering, says municipalities and water utilities all have drinking water management strategies to ensure the water they provide is safe and plentiful. However, a natural disaster, a breach in the supply or contamination at the treatment plant can put water supplies—and human health—at risk.
“Freshwater is essential to sustain ecosystem health and our survival,” says Dr. Mian. “But Earth’s once plentiful freshwater resources are now under increasing pressure due to population growth, urbanization and climate change.”
As water supplies become more threatened, not only is providing safe water a priority, but suppliers must also ensure that doing so will have low environmental and economic implications.
“The quality of drinking water is contingent on several important attributes such as water extraction, treatment, delivery, cost and the disposal of used water,” says Dr. Mian, who conducts research in UBC’s Life Cycle Management Lab. “Those factors can all be impacted by climate change. And they have a significant environmental influence in terms of natural resource depletion, waste generation and greenhouse gas emissions.”
Dr. Mian and his fellow researchers have developed an integrated assessment framework that combines water qualitywith lifecycle assessment techniques. Working with data from small and medium-sized communities, they provided a way to assess the long-term applicability of water systems that can provide safe drinking water to people.
According to Dr. Mian, the framework provides a different lens into a more holistic view of drinking water management and its components.
“We measure factors such as water quality, changes to the environment and potential costs to determine performance data and benchmarking, thereby providing important tools to ensure these systems experience long-term effectiveness and sustainability,” he adds.
Through assessment and management of these key factors, water can flow to a community at a reasonable cost while conserving natural resources and ensuring environmental protection.
The study evaluated the overall performance of several water distribution systems by combining the above-mentioned criteria. Water distributors can apply the framework to determine the best distribution management system that will provide safe drinking water to their consumers with minimal environmental and economic costs.
The framework continues to be tested to ensure it is flexible based on any setting, community or system.
“There are no perfect decision-making techniques. The results often vary based on the available data and assumptions,” Dr. Mian adds. “But this framework can be useful for all water distributors.”
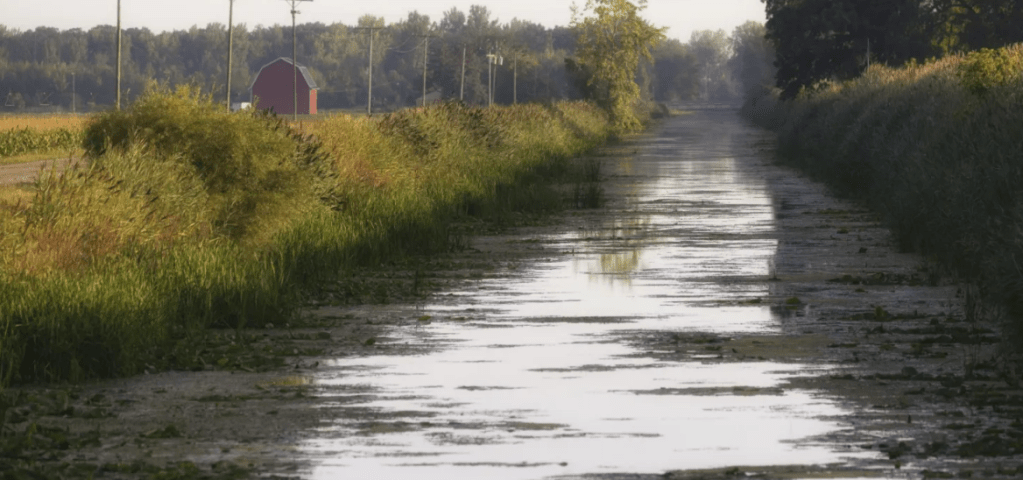
Small isolated wetlands that are full for only part of the year are often the first to be removed for development or agriculture, but a new study shows that they can be twice as effective in protecting downstream lake or river ecosystems than if they were connected to them.
Using a new method involving satellite imagery and computer modeling, researchers from the University of Waterloo found that since these small wetlands are disconnected, pollutants such as nitrogen and phosphorous get trapped. This is the first study to use satellite data for estimating nutrient retention.
All wetlands act like sponges, providing flood protection by absorbing the vast volume of water that can be suddenly released from rainfall or snowmelt. Improving water quality, providing habitat, increasing biodiversity, and trapping carbon are just some of the many environmental benefits wetlands provide. Their destruction increases our vulnerability to the extreme effects of climate change, including flooding, drought and the frequency of storms.
“This is especially a concern in regions like southern Ontario, which has already lost more than 70 per cent of its wetlands and is under threat to lose more from increasing population and developmental pressures. The rise in human population also increases the amount of pollution,” said Dr. Nandita Basu, a professor at Waterloo and Canada Research Chair in Global Water Sustainability and Ecohydrology. “If pollutants aren’t caught by small wetlands, then they’ll run into our lakes, beaches and eventually impact our supply of drinking water and ability to use the beaches for recreation.”
Basu, jointly appointed to the Department of Earth and Environmental Sciences and the Department of Civil and Environmental Engineering at Waterloo, worked with Dr. Frederick Cheng, who was her doctoral student on the project.
They used 30 years of satellite imagery from across the United States to determine how 3,700 wetlands were filling up and draining as a function of seasons and climate. Next, they estimated how much nitrogen would be removed by these water bodies.
“Being disconnected can actually be better because they are catching the pollutants and retaining them as opposed to leaking them back to the stream waters,” said Cheng, first author of the study and currently a postdoctoral fellow at Colorado State University.
Next, Basu and her team will apply these techniques to Canadian wetlands across the Great Lakes basin as well as the prairie region in Western Canada.
Their paper appears in Environmental Research Letters.
Earlier this year, southern England experienced its driest July on record. The drought affected many parts of the UK and grew so acute that Thames Water’s hosepipe ban will remain in forceinto 2023.
But rainfall in August was heavy. The volume of rain causedoutdated drainage and sewerage systems to overflow, degrading the quality of many of the UK’s rivers.
Extreme weather patterns such as these are set to dominate our future. The Environment Agency predicts that demand for water in southern England may outstrip supply in the next 20 years. Yet, at the same time, as many as 5.2 million UK properties are threatened by flooding.
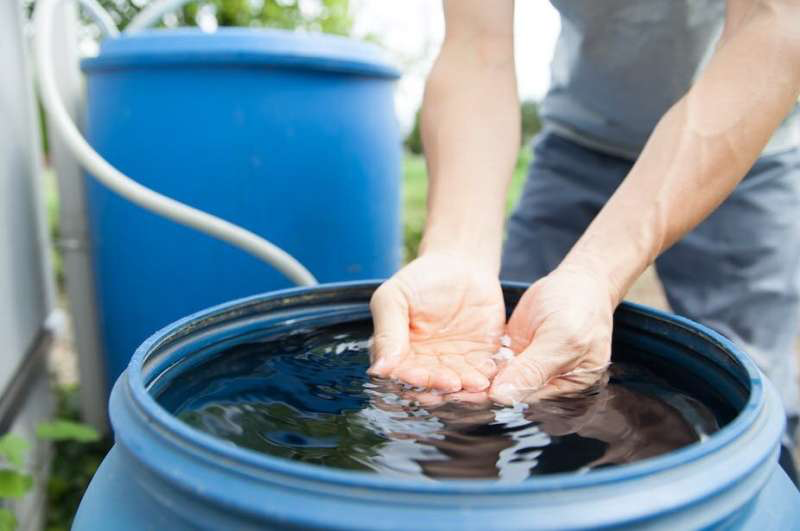
Our research suggests that collecting rainwater in water barrels may offer a solution to these problems. This cheap, small-scale intervention could help protect households against water risks while engaging those involved with water issues. Unfortunately, the government tends to ignore this scale of intervention.
Engineered solutions to water issues
Water management in England is largely isolated to large infrastructure projects. Reservoirs are built to withstand drought and larger sewers are seen as the solution to flooding and water pollution.
But these approaches are costly; Central London’s new sewer, the Thames Tideway Tunnel, will cost £4.9 billion.
They can also harm the environment. The Thames Tideway tunnel will prolong the energy-intensive pumping of dirty sewage, while building reservoirs often involves the flooding of agricultural land and wildlife habitats.
These government and water industry solutions also fail to engage the public. Public awareness of the dual drought and flood crises, therefore, remains low. According to a reportpublished in 2020 and partly funded by the Environment Agency, 72% of people surveyed believe that the UK has enough water to meet the country’s needs.
Re-thinking water management
There are other ways to manage the UK’s water better.
The roof area of an average terraced house in the UK (30m²) receives 19,000–55,000 liters of rain each year. Our modeling suggests that a significant proportion of household water consumption could be met by collecting this water.
Averaged across the UK, we found that a 210-liter rain tank—equivalent to a small bath—could supply 15% of a household’s total annual water consumption. But this will be subject to clear geographic and seasonal variation.
The calculation accounts for the loss of rainwater through processes such as evaporation. Current regulations also restrict the use of rain tank water to non-potable demands, such as flushing toilets.
In the wetter northwest of Scotland, we found that 26% of a household’s annual water consumption could be met by collecting rainwater. In contrast, only 9% could be supplied in the southeast of England, dropping to 4% in the driest months. Although this seems a low value, it still equates to 14 liters of water per household each day.
Reducing the risk of flooding and pollution
In the future, wetter winters will also become more common. This will amplify the risk of flooding and water pollution. Our research suggests that a network of small water barrels fitted across towns or cities could substantially reduce these risks.
In the event of a storm, a 210-liter water barrel can capture 7mm of rainfall from the roof of an average terraced house. To put this in context, in the English city of Hull, a storm that deposits 22.3 mm of rainfall is sufficient to cause flooding. This amount of rain typically falls once every ten years.
So if we can store 7mm of that rain in a water barrel, then the amount that is required to cause a flood rises to 28.6mm. A storm that results in this amount of rainfall only occurs once every 30 years.
This approach is not without its limitations. The area that is occupied by roofs is far smaller than the total area over which rain falls. The hydrology of a flood is also complex, including the movement of water through a catchment from uplands to lower-lying areas.
But if used in combination with sustainable drainage systemsand other natural flood management measures, water barrels could make a small but meaningful contribution to reducing the threat of flooding and water pollution. Through various processes, sustainable drainage systems provide an alternative to the direct channeling of rainwater through pipes and sewers to nearby watercourses. By providing additional storage in ponds, for example, the flow of surface water can be reduced.
Even then, large numbers of households would still need to install water barrels for this approach to have any effect. We have worked with local voluntary organizations to establish a non-profit cooperative called Susdrainable that specializes in the design and installation of rain tanks. Together, we have installed rain tanks on public buildings in Hull and are working on signage and leaflets to provide households with the information they need to participate in water management.
Water barrels are not a replacement for large-scale water management infrastructure, but they do offer a cheaper mitigation option—one that also engages the public with waterissues. There is a role for everyone as we prepare for a future dominated by drought and flood.
South Africa’s major cities in the Gauteng Province—the country’s economic heartland—are experiencing major water shortages. In Johannesburg and Tshwane taps have run dry, with numerous areas experiencing intermittent supply while some areas have no water at all.
The province has metropolitan areas—the City of Johannesburg, Tshwane and Ekurhuleni. All are affected. Rand Water, the water authority for the region, has imposed restrictions of 30%. This will be revisited when the system recovers.
The last water shutdown was in November 2021 when Rand Water cut off water for 54 hours so that it could to do infrastructure maintenance. There were also restrictions during the drought in 2015-2017.
The province serves as a perfect example of how an area can experience water shortages and intermittent supply even though dams are full.
The biggest problem lies with decaying infrastructure. This includes water storage, water supply and treatment. In addition water resources are poorly managed. And there’s been poor planning, a lack of financing to maintain aging infrastructure and to keep up with rapid urbanization.
The crisis in Gauteng has been developing over many decades. The water and sanitation infrastructure in Johannesburg is old—some water pipeswere installed nearly a century ago. In addition, there’s been exponential growth—of businesses and the population.
Gauteng is South Africa’s smallest province, but contributes 45% to the country’s total economic output. All economic sectors have expanded in the past decades.
The province’s population has also increased to just over 16 million—up from 12 million in 2011.
Rand Water has indicated that high water consumption is to blame for the current shortages. Estimates suggest that water consumption in Gauteng per person per day is over 300 liters, well above the global average of 173 liters. Importantly, this estimate includes non-revenue water—water that’s lost before it reaches the consumer.
The Gauteng Province is unfortunately finding itself in a perfect storm of major intermittent water supply due to continued power blackouts, high temperatures leading to above average water use as well as major continued water losses through bursting pipes and major leaks due to dilapidated infrastructure.
There’s an urgent need to put water higher on the country’s agenda. Various water problems are escalating at a rapid rate.
The decline
The quality of water infrastructure in South Africa is deemed to be below average and deteriorating in comparison to comparable countries such as Nigeria and Zambia.
A number of factors have contributed to the current state of affairs.
Firstly, the poor quality of infrastructure. This is attributed to insufficient long-term planning, poor construction techniques and materials as well as the poor maintenance of existing infrastructure.
South Africa’s infrastructure is mostly aged (more than two decades old), in a state of decay. In its 2017 infrastructure report card the South African Institution of Civil Engineering concluded that the country’s infrastructure was at risk due to its low overall grade of D+.
Secondly, the management of consumption has been poor. South Africa is a water scarce country. Yet the average domestic water use is estimated at 237 liters per person per day, 64 liters higher than the international benchmark of 173 liters per person per day.
High consumption is partly attributed to high municipal non-revenue water. This stands at 41% This means that 41% of water is lost due to leakages owing to poor operation and maintenance of existing aged water infrastructure, commercial losses caused by meter manipulation or other forms of water theft and lastly, unbilled authorized consumption such as firefighting.
Global best practice is 15% .
Thirdly, a lack of institutional capacity at a local level has limited the capability of local governments to provide infrastructure. Low expenditure levels on infrastructure investment is evidence of these capacity deficits despite the national governmentcontinuously emphasizing the need for more investment.
Fourthly, there has been massive under funding for decades. This has led to decay and in some instances a collapse of infrastructure. Government spending on infrastructure reached its peak in the 1960s to late 1970s. There was then a steady decline from 1977. In 2000, the country’s per capita spending on infrastructure reached a 40-year low and warnings were issued about the condition of bulk water and sanitation infrastructure.
Other factors contributing to the current crisis include poor management (at national and local level), delays in implementation, insufficient institutional capacity and competence and a lack of political will.
Fifth, a multi-layered and complex system of managing water resources. Numerous stakeholders at different levels of government play a role in the management of water resources.
The Department of Water and Sanitation is the custodian of the country’s water. It is ultimately responsible for ensuring that water resources are protected, used, developed, conserved, managed and controlled effectively. The development and management of national water resource infrastructure also forms part of the department’s functions.
Other managing agents include catchment management agencies (managing water resources at a regional or catchment scale), water user institutions (providing the institutional structure) as well as water service authorities which include local government and municipalities, water utilities and private firms responsible for governing domestic water supply services.
Johannesburg Water therefore sources water from Rand Water, which supplies potable water to the Gauteng Province and other areas. The City of Johannesburg and Johannesburg Water, for example, are responsible for dealing with growing demands and the management of the delivery and services.
What’s needed
The following steps should be considered to try and ensure continued suitable water supply within the Gauteng Province as well as other areas experiencing the same issues:
A suitable budget needs to be made available immediately to address priority areas. Proper planning and informed actions, not just promises, is a major requirement. Johannesburg Water estimated in 2020 that R88 billion was required for the replacement of infrastructure with a total renewal backlog of R20.4 billion.
This amount of money might be a suitable investment to address the dilapidated state of infrastructure. But it should have been assigned much sooner.
Dilapidated infrastructure needs to be upgraded and properly maintained. The lack of maintenance has contributed to leaking pipes and faulty infrastructure which now needs to be fixed as a matter of urgency as it contributes to major physical water losses. This won’t solve the problem overnight given that there have been decades of neglect. But a start needs to be made.
Capacity constraints or lack of skills need to be identified and addressed.
Private sector investment in water infrastructure needs to be incentivised together with the promotion of private-public partnerships.
Implementation of water conservation and demand management.
Political will to move away from simply providing infrastructure to maintenance, rehabilitation and upgrading of existing infrastructure.