Groundwater reservoirs in Bavaria have warmed considerably over the past few decades. A new study by researchers at Martin Luther University Halle-Wittenberg (MLU) compares temperatures at 35 measuring stations, taken at different depths, with data from the 1990s. Water found at a depth of 20 metres was almost one degree warmer on average than 30 years ago. The findings were published in the journal “Frontiers in Earth Science.”
As the air warms, the ground also becomes warmer over time — ultimately resulting in warmer groundwater. Geologists call this thermal coupling. “Unlike the atmosphere, however, the earth’s sub-surface is very sluggish,” explains Professor Peter Bayer, a geoscientist at MLU and co-author of the study. Because the ground below the surface does not react to short-term temperature fluctuations and thus tends to reflect long-term trends, it is a good indicator of climate change.
“This ground warming effect has been known to scientists, however there is still little data on it,” explains Bayer. For the new study, Bayer and his doctoral student Hannes Hemmerle repeated measurements that had been carried out in the 1990s at 35 measuring stations in groundwater reservoirs in Bavaria. The measuring points are distributed throughout the state, which provides a rare insight into the development of an entire region.
The geologists were able to show that almost all the groundwater reservoirs they investigated had warmed up in a similar way over the decades. “Climate change has a very clear effect at depths starting at around 15 metres; at that point short-term local or seasonal fluctuations can no longer be measured,” explains Hemmerle. The groundwater at depths of 20 metres was, on average, nearly 0.9 degrees Celsius warmer than in the 1990s. At depths of 60 metres it was still nearly 0.3 degrees warmer. During the same period, the average air temperature rose by 1.05 degrees Celsius.
“It can be assumed that the groundwater will warm up even more as a delayed reaction to air temperatures and that it will continue to react to rising atmospheric temperatures in the future,” says Hemmerle. The consequences of this warming are still difficult to gauge, says Bayer, who adds, higher water temperatures affect the growth of microbes and put pressure on underground ecosystems that are adapted to very constant temperatures.
In order to get a feel for the magnitude of the measurements, Bayer and Hemmerle also compared ground warming at a depth of 15 metres with Bavaria’s annual heating requirements. Their findings: the increase in temperature correlates to about ten percent of demand. “At least a portion of the heat could possibly be reused as geothermal energy,” says Bayer. However, the results cannot be directly transferred to the whole of Germany. “But it can be assumed that the trend is the same,” says Hemmerle.make a difference: sponsored opportunity
Hannes Hemmerle, Peter Bayer. Climate Change Yields Groundwater Warming in Bavaria, Germany. Frontiers in Earth Science, 2020; 8 DOI: 10.3389/feart.2020.575894
A new polymer-based, solid-state transistor can more sensitively detect a weed killer in drinking water than existing hydrogel-based fluorescence sensor chips. The details were published in Chemistry-A European Journal.
The sensor is a specially designed organic thin-film transistor based on semiconducting molecules of carboxylate-functionalized polythiophene (P3CPT). What’s special about this particular device is that, unlike other conjugated polymer-based sensors, this one is a solid-state device that can conduct an electric current when placed inside a fluid.
The device, designed by Tsuyoshi Minami of The University of Tokyo’s Institute of Industrial Science and colleagues, works by adding copper ions, which bind to the P3CPT molecules. When the device is placed in water that contains even the smallest amount of the herbicide glyphosate, the copper ions leave the P3CPT molecules to attach to the glyphosate molecules. This causes a detectable reduction in the flow of electric current through the device. Glyphosate is a commonly used weed killer in agriculture, and there are concerns that its presence in drinking water can be harmful to human health.
The scientists found that the device was so sensitive that it could detect as low as 0.26 parts per million of glyphosate in drinking water. The team compared their new device to a conventional fluorescence sensor chip, which was only capable of detecting down to 0.95 parts per million of glyphosate. To put this into perspective, the maximum allowable amount of glyphosate in drinking water, according to the United States Environmental Protection Agency, is 0.7 parts per million.
The scientists believe that the sensitivity of their device boils down to interactions occurring within individual polymer molecules and between neighbouring ones. Commonly used fluorescence sensors depend solely on interactions occurring within individual molecules.
“Our device could be a novel solid-state platform for sensing target molecules in aqueous media,” says Minami. The researchers are currently working on further developing their polythiophene-based sensors.make a difference: sponsored opportunity
Yui Sasaki, Koichiro Asano, Tsukuru Minamiki, Zhoujie Zhang, Shin‐ya Takizawa, Riku Kubota, Tsuyoshi Minami. A Water‐Gated Organic Thin‐Film Transistor for Glyphosate Detection: A Comparative Study with Fluorescence Sensing. Chemistry – A European Journal, 2020; 26 (64): 14525 DOI: 10.1002/chem.202003529
FOR MORE INFORMATION: Institute of Industrial Science, The University of Tokyo. “Ultrasensitive transistor for herbicide detection in water.” ScienceDaily. ScienceDaily, 1 December 2020. <www.sciencedaily.com/releases/2020/12/201201124142.htm>.
Twice as much freshwater is stored offshore of Hawai’i Island than was previously thought, according to a University of Hawai’i study with important implications for volcanic islands around the world. An extensive reservoir of freshwater within the submarine southern flank of the Hualālai aquifer has been mapped by UH researchers with the Hawai’i EPSCoR ‘Ike Wai project. The groundbreaking findings, published in Science Advances, reveal a novel way in which substantial volumes of freshwater are transported from onshore to offshore submarine aquifers along the coast of Hawai’i Island.
This mechanism may provide alternative renewable resources of freshwater to volcanic islands worldwide. “Their evidence for separate freshwater lenses, stacked one above the other, near the Kona coast of Hawai’i, profoundly improves the prospects for sustainable development on volcanic islands,” said UH Manoa School of Ocean and Earth Science and Technology (SOEST) Dean Brian Taylor.
Paradigm shift
Through the use of marine controlled-source electromagnetic imaging, the study revealed the onshore-to-offshore movement of freshwater through a multilayer formation of basalts embedded between layers of ash and soil, diverging from previous groundwater models of this area. Conducted as a part of the National Science Foundation-supported ‘Ike Wai project, research affiliate faculty Eric Attias led the marine geophysics campaign.
“Our findings provide a paradigm shift from the conventional hydrologic conceptual models that have been vastly used by multiple studies and water organizations in Hawai’i and other volcanic islands to calculate sustainable yields and aquifer storage for the past 30 years,” said Attias. “We hope that our discovery will enhance future hydrologic models, and consequently, the availability of clean freshwater in volcanic islands.”
Co-author Steven Constable, a professor of geophysics at the Scripps Institution of Oceanography, who developed the controlled source electromagnetic system used in the project, said, “I have spent my entire career developing marine electromagnetic methods such as the one used here. It is really gratifying to see the equipment being used for such an impactful and important application. Electrical methods have long been used to study groundwater on land, and so it makes sense to extend the application offshore.”
Kerry Key, an associate professor at Columbia University who employs electromagnetic methods to image various oceanic Earth structures, who not involved in this study, said, “This new electromagnetic technique is a game changing tool for cost-effective reconnaissance surveys to identify regions containing freshwater aquifers, prior to more expensive drilling efforts to directly sample the pore waters. It can also be used to map the lateral extent of any aquifers already identified in isolated boreholes.”
Two-times more water
Donald Thomas, a geochemist with the Hawai’i Institute of Geophysics and Planetology in SOEST who also worked on the study, said the findings confirm two-times the presence of much larger quantities of stored groundwater than previously thought.
“Understanding this new mechanism for groundwater…is important to better manage groundwater resources in Hawai’i,” said Thomas, who leads the Humuʻula Groundwater Research project, which found another large freshwater supply on Hawai’i Island several years ago.
Offshore freshwater systems similar to those flanking the Hualālai aquifer are suggested to be present for the island of O’ahu, where the electromagnetic imaging technique has not yet been applied, but, if demonstrated, could provide an overall new concept to manage freshwater resources.
The study proposes that this newly discovered transport mechanism may be the governing mechanism in other volcanic islands. With offshore reservoirs considered more resilient to climate change-driven droughts, volcanic islands worldwide can potentially consider these resources in their water management strategies.
This project is supported by the National Science Foundation EPSCoR Program Award OIA #1557349.make a difference: sponsored opportunity
Eric Attias, Donald Thomas, Dallas Sherman, Khaira Ismail and Steven Constable. Marine electrical imaging reveals novel freshwater transport mechanism in Hawai‘i. Science Advances, 2020 DOI: 10.1126/sciadv.abd4866
FOR MORE INFORMATION: University of Hawaii at Manoa. “Offshore submarine freshwater discovery raises hopes for islands worldwide.” ScienceDaily. ScienceDaily, 25 November 2020. <www.sciencedaily.com/releases/2020/11/201125154829.htm>.
The Rappbode Reservoir in the Harz region is Germany’s largest drinking water reservoir, supplying around one million people with drinking water in areas including the Halle region and the southern part of the state of Saxony-Anhalt. Water temperatures in the reservoir now have the potential to increase significantly due to climate change. If average global warming reaches between 4 and 6 degrees by the year 2100, as the current trend suggests, temperature conditions in the Rappbode Reservoir will become comparable to those in Lake Garda and other lakes south of the Alps. In an article in Science of the Total Environment magazine, a team of researchers led by the Helmholtz Centre for Environmental Research (UFZ) writes that the reservoir’s operators could partially offset the impacts this will have on the drinking water supply — to do so, they would have to change the way the reservoir is managed.
The impacts of climate change can already be seen in the Rappbode Reservoir: Over the past 40 years, the water surface temperature in the reservoir has increased by around 4 degrees in the summer months. This trend could continue, as has now been demonstrated by a team of researchers led by Dr Karsten Rinke, who researches lakes at UFZ. Working on the basis of a lake model developed by US researchers, the team took into account potential reservoir management strategies to forecast the impacts climate change could have on water temperatures and on the lake’s physical structure, which control the stratification and seasonal mixing of the body of water. Their research looked at three scenarios for future greenhouse gas emissions. The so-called “representative concentration pathways” (RCPs) describe whether greenhouse gas emissions will be halted (RCP 2.6), will continue to rise (RCP 6.0) or even continue to increase unabated (RCP 8.5) by 2100. According to the Intergovernmental Panel on Climate Change IPCC, the latter case would result in average global warming of more than 4 degrees by the end of this century.
For the RCP 2.6 and RCP 6.0 scenarios, the study’s authors projected that the average temperature on the water surface of the Rappbode Reservoir is set to increase by 0.09 degrees or 0.32 degrees respectively every decade by the year 2100. This would correspond to a total increase of around 0.7 degrees (RCP 2.6) and around 2.6 degrees (RCP 6.0) by the end of this century. As expected, the increase in temperatures would be the highest under the RCP 8.5 scenario, which would see the water temperature increasing by 0.5 degrees every decade or approx. 4 degrees by 2100.
However, in terms of using drinking water, what happens in the deeper strata of the reservoir — i.e., at depths of 50 metres and below — is more serious, as this is where raw water is taken out before being treated to prepare it as drinking water. It is true that impacts by 2100 would be relatively minor under the RCP 2.6 and RCP 6.0 scenarios, as the water temperature would continue to be around 5 degrees year-round. However, water temperatures will increase significantly under the RCP 8.5 scenario — by nearly 3 degrees by the end of the century. As a result, the water in the depths of the reservoir would warm to around 8 degrees. “This would turn a reservoir in Germany’s northernmost highlands into a body of water comparable to Lake Maggiore or Lake Garda nowadays,” says UFZ scientist Rinke. An increase of this magnitude would have consequences because it would significantly accelerate the speed of biological metabolic processes. “A temperature increase to 8 degrees nearly doubles oxygen demand, that is the amount of oxygen organisms consume during their respiration and degradation processes,” says lead author Chenxi Mi, who is focusing on climate impacts on the Rappbode Reservoir in his doctorate at UFZ. Increased oxygen consumption will place an additional pressure on the water’s oxygen budget, because the duration of summer stagnation — the phase of stable temperature stratification in lakes in which the deep water is closed off to oxygen supply from the atmosphere — is already extending due to climate change. Plus, warmer water is also unable to absorb as much oxygen. Potential consequences include intensified dissolution of nutrients and dissolved metals from the sediment, algae growth and an increase in blue-green algae.
In other words, the 8.5 scenario would have impacts on the drinking water supply if it were to occur. The reservoir’s operators draw the raw water from the lowermost strata for good reason, as the water there is cold and contains only low levels of suspended substances, dissolved metals, algae, bacteria and potentially pathogenic microorganisms. If the oxygen content there decreases more rapidly due to the rising water temperature, the risk of contamination increases, for example due to substances released from the sediment and greater bacteria growth. Treating the water would therefore require a greater effort on the part of the operators, and they would have to deal with higher demands in terms of the treatment capacity they would need to reserve. “This means preventing the deep water from warming is also worthwhile from the perspective of the drinking water supply, and the ideal way to do this is ambitious climate policies that limit warming,” says Rinke.
But the operators are not completely powerless against the warming of the deep water in the reservoir. The model simulations set up by Rinke’s team show that a share of the heat can be exported by using a clever system to withdraw the water. This has to do with the water that is released to the downstream waters that is, the water that is withdrawn and drains into the water course below the reservoir in order to keep the discharge conditions there stable. This so-called downstream discharge would need to be withdrawn not from the lower strata as it has been thus far but rather from near the surface. “This approach would allow the additional heat caused by climate change to be released again,” Rinke explains. However, he adds, it would be impossible to prevent the deep water from heating up if the air temperature increases beyond 6 degrees. “Even though operators have had to cope more with a shortage of water due to the very dry years we’ve had recently, it’s just as important to think about the quality of the water. In terms of reservoir management, we definitely have options and can respond to new conditions caused by climate change. In this way, we can alleviate certain negative impacts through climate adaptation measures.”
The operators of the Rappbode Reservoir at the Talsperrenbetrieb Sachsen-Anhalt company are aware of this. They have been working closely together with Karsten Rinke and his team of researchers at UFZ for many years to assess the impacts of climate change and discussed about potential options for adapting the Rappbode Reservoir. The Talsperrenbetrieb is already planning new infrastructures that will make it possible to implement the new management strategies.make a difference: sponsored opportunity
Chenxi Mi, Tom Shatwell, Jun Ma, Yaqian Xu, Fangli Su, Karsten Rinke. Ensemble warming projections in Germany’s largest drinking water reservoir and potential adaptation strategies. Science of The Total Environment, 2020; 748: 141366 DOI: 10.1016/j.scitotenv.2020.141366
FOR MORE INFORMATION: Helmholtz Centre for Environmental Research – UFZ. “Climate change presents new challenges for the drinking water supply.” ScienceDaily. ScienceDaily, 23 November 2020. <www.sciencedaily.com/releases/2020/11/201123112457.htm>.
The gateway to more informed water use and better urban planning in your city could already be bookmarked on your computer. A new Stanford University study identifies residential water use and conservation trends by analyzing housing information available from the prominent real estate website Zillow.
The research, published Nov. 18 in Environmental Research Letters, is the first to demonstrate how new real estate data platforms can be used to provide valuable water use insights for city housing and infrastructure planning, drought management and sustainability.
“Evolving development patterns can hold the key to our success in becoming more water-wise and building long-term water security,” said study senior author Newsha Ajami, director of urban water policy at Stanford’s Water in the West program. “Creating water-resilient cities under a changing climate is closely tied to how we can become more efficient in the way we use water as our population grows.”
It’s estimated that up to 68 percent of the world’s population will reside in urban or suburban areas by 2050. While city growth is a consistent trend, the types of residential dwellings being constructed and neighborhood configurations are less uniform, leading to varying ways in which people use water inside and outside their homes. The people living within these communities also have different water use behaviors based on factors such as age, ethnicity, education and income. However, when planning for infrastructure changes, decision-makers only take population, economic growth and budget into account, resulting in an incomplete picture of future demand. This, in turn, can lead to infrastructure changes, such as replacing old pipes, developing additional water supply sources or building wastewater treatment facilities, that fail to meet community needs.
Zillow and other real estate websites gather and publish records collected from different county and municipal agencies. These websites can also be updated by homeowners, making them rich sources of information that can otherwise be difficult and timely to obtain. The Stanford researchers used data from Zillow to gather single-family home information, including lot size, home value and number of rooms in Redwood City, California, a fast-growing, economically diverse city with various styles of houses, lots and neighborhoods. Then, they pulled U.S. Census Bureau demographic information for the city, looking at factors including average household size and income along with the percentage occupied by renters, non-families, college educated and seniors.
Coupling the Zillow and census data and then applying machine learning methods, the researchers were able to identify five community groupings, or clusters. They then compared the different group’s billing data from the city’s public works department to identify water usage trends and seasonal patterns from 2007 to 2017 and conservation rates during California’s historic drought from 2014 to 2017.
“With our methods incorporating Zillow data we were able to develop more accurate community groupings beyond simply clustering customers based on income and other socioeconomic qualities. This more granular view resulted in some unexpected findings and provided better insight into water-efficient communities,” said lead author Kim Quesnel, a postdoctoral scholar at the Bill Lane Center for the American West while performing the research.
They found the two lowest income groups scored average on water use despite having a higher number of people living in each household. The middle-income group had high outdoor water use but ranked low in winter water use, signaling efficient indoor water appliances — such as low-flow, high-efficiency faucets and toilets — making them an ideal target for outdoor conservation features such as converting green spaces or upgrading to weather-based or smart irrigation controllers.
The two highest income groups, characterized by highly educated homeowners living in comparatively larger homes, were the most dissimilar. One cluster — younger residents on smaller lots with newer homes in dense, compact developments — had the lowest water use of the entire city. The other high-income cluster consisting of older houses built on larger lots with fewer people turned out to be the biggest water consumer. The finding goes against most previous research linking income and water use, and suggests that changing how communities are built and developed can also change water use patterns, even for the most affluent customers.
All groups showed high rates of water conservation during drought. Groups with the highest amount of savings (up to 37 percent during peak drought awareness) were the two thirstiest consumers (the high-income, large-lot and middle-income groups) demonstrating high potential for outdoor water conservation. Groups with lower normal water usage were also able to cut back, but were more limited in their savings. Understanding these limitations could inform how policymakers and city planners target customers when implementing water restrictions or offering incentives such as rebates during drought.
This research lays the framework for integrating big data into urban planning, providing more accurate water use expectations for different community configurations. Further studies could include examining how data from emerging online real estate platforms can be used to develop neighborhood water use classifications across city, county or even state lines. An additional area of interest for the researchers is examining how water use consumption is linked to development patterns in other kinds of residential areas, for example in dense cities.
“Emerging, accessible data sources are giving us a chance to develop a more informed understanding of water use patterns and behaviors,” said Ajami. “If we rethink the way we build future cities and design infrastructure, we have the opportunity for more equitable and affordable access to water across various communities.”make a difference: sponsored opportunity
Story Source:
Materials provided by Stanford University. Original written by Michelle Horton. Note: Content may be edited for style and length.
Journal Reference:
Kimberly J Quesnel, Saahil Agrawal, Newsha K Ajami. Diverse paradigms of residential development inform water use and drought-related conservation behavior. Environmental Research Letters, 2020; 15 (12): 124009 DOI: 10.1088/1748-9326/abb7ae
The world is awash with nitrogen. In agriculture, nitrogen is used as a fertiliser to increase output, but this causes one of the biggest environmental problems of our time. Nitrogen pollution has detrimental effects on water and soil and is also harmful to human and animal health. What’s more, when the air or rain carry nitrogen into unfertilised habitats, such as bogs or forests, it causes a decline in natural biodiversity.
National governments have it within their power to curb the problem. What is required are national and international policies that steer the global food system towards higher yields and a much lower environmental impact. However, research to date has barely touched on the extent to which countries actually influence their nitrogen pollution and their crop yields.
Quantifying countries’ overall impact
Now, ETH researchers David Wüpper and Robert Finger from the Chair of Agricultural Economics and Policy have joined forces with other international authors to investigate for the first time the overall impact of almost every country in the world on their nitrogen pollution and crop yields. The results of their study were recently published in the journal Nature Food.
In this publication, the researchers show that countries do in fact have a major impact, especially on levels of nitrogen pollution. In fact, countries’ impact on pollution is often multiple times greater than their effect on crop yields.
Curbing use without compromising yield
In many countries much greater use of nitrogen fertiliser has only marginally reduced their yield gap — the difference between potential yield and the actual yield achieved. Overall, when individual countries attempt to close the yield gap by 1 percent, this is associated with a 35 percent rise in nitrogen pollution on a global scale. In other words, some countries are using enormous amounts of fertiliser but achieve very little in the way of additional yield. This leads the researchers to conclude that many countries could curb their fertiliser use without seeing yield reductions.
In their study, they also identified the factors that explain overall nitrogen use and pollution relative to their crop yields. Key factors include the quality of institutions, the degree of economic development and the size of the population, for example, but also the share of agriculture in the country’s total economy.
Another major factor that influences a country’s nitrogen pollution is direct state subsidies to reduce the cost of nitrogen fertiliser. However, indirect subsidies and policy measures that affect the price of agricultural products in relation to fertiliser costs also play a role, as do regulations and laws, farmer training, technology and even trade structures.
Evaluating global nitrogen and yield data
One example of how country-specific factors influence nitrogen pollution can be seen at the border between Kazakhstan and China, a region that is naturally dry with sparse vegetation. Satellite images show that on the Chinese side the vegetation is lush and green right up to the border, but on the Kazakh side it changes abruptly and becomes less green. This points to the presence of irrigation and ample amounts of nitrogen fertiliser on the Chinese side.
“Such a marked difference in the vegetation can’t be a natural phenomenon,” says Wüpper, lead author of the study. “This example illustrates that the country in which the fields are located is a decisive factor for yield and nitrogen pollution,” he explains. “However, it would be possible for China to achieve a similar yield with significantly less nitrogen pollution.”
Also Switzerland is hardly a poster child for nitrogen pollution levels. Like other European countries, but considerably more, it continues to apply nitrogen fertiliser in great volumes that are too much for the crops to fully absorb. The surplus ends up in streams, lakes and other ecosystems.
“Agriculture in Switzerland is very intensive,” Wüpper says. He explains that this has a direct impact on nitrogen pollution, not least because the fodder that Swiss animals eat comes from abroad. However, the manure produced by the livestock is spread on Swiss soil, where it contributes to the levels of nitrogen pollution.
Economic instruments are one policy option
“Overall, however, there’s an uneven balance in the distribution of fertiliser resources around the globe,” the researchers say to sum up. While Switzerland has an oversupply, other regions of the world don’t have enough. In parts of sub-Saharan Africa, for example, farmers underuse nitrogen fertiliser. However, if they were to increase their use of nitrogen fertiliser only marginally, they would be able to significantly increase their yields. Mitigating this global fertiliser imbalance would enable yields to be considerably increased in some places and pollution to be greatly reduced in others.
One way to achieve this would be to adjust the cost of nitrogen fertiliser. In countries where too much is used, the cost of fertiliser should go up, e.g. by introducing a nitrogen tax, or by other policy instruments and adjustments. Conversely, in countries in which too little nitrogen fertilizer is used, the price should go down, e.g. by introducing a nitrogen subsidy, or by other policy instruments and adjustments.
Another approach involves changes on farms themselves. Government and industry could offer farmers incentives to make their crop production more environmentally friendly. They could, for example, promote certain production processes that increase the efficiency of nitrogen use. Moreover, farmers who use less nitrogen and consequently have to contend with lower yields could receive financial compensation from the state.
Huge potential in precision farming
New technologies could also increase nitrogen efficiency. “We’re talking about what’s known as precision agriculture, a concept in which fertiliser is applied only where it is actually needed. This can increase the efficiency of use and reduce environmental problems without decreasing output,” Finger explains.
“But consumption can also make a big difference,” Wüpper adds. He points out that one-third of all food produced goes to waste, intensifying nitrogen pollution and environmental damage. “If we cut down on food waste, we reduce environmental problems, too,” he says. A much meat-reduced diet also helps to cut back excess levels of fertiliser because if farmers produce less meat, less manure ends up on the fields.make a difference: sponsored opportunity
Story Source:
Materials provided by ETH Zurich. Original written by Peter Rüegg. Note: Content may be edited for style and length.
Journal Reference:
David Wuepper, Solen Le Clech, David Zilberman, Nathaniel Mueller, Robert Finger. Countries influence the trade-off between crop yields and nitrogen pollution. Nature Food, 2020; 1 (11): 713 DOI: 10.1038/s43016-020-00185-6
Researchers at the University of Sussex have found widespread contamination of English rivers with two neurotoxic pesticides commonly used in veterinary flea products: fipronil and the neonicotinoid imidacloprid. The concentrations found often far exceeded accepted safe limits.
These chemicals are banned for agricultural use due to the adverse environmental effects, but there is minimal environmental risk assessment for pesticides used on domestic cats and dogs. This is due to the assumption that there are likely to be fewer environmental impacts due to the amount of product used.
But there is growing concern that this assumption may be incorrect. To investigate this, Professor Dave Goulson and Rosemary Perkins from the University of Sussex analysed data gathered by the Environment Agency in English waterways between 2016-18. They found that fipronil was detected in 98% of freshwater samples, and imidacloprid in 66%.
Rosemary Perkins, a PhD student at Sussex and a qualified vet, said: “The use of pet parasite products has increased over the years, with millions of dogs and cats now being routinely treated multiple times per year.”
“Fipronil is one of the most commonly used flea products, and recent studies have shown that it degrades to compounds that are more persistent in the environment, and more toxic to most insects, than fipronil itself. Our results, showing that fipronil and its toxic breakdown products are present in nearly all of the freshwater samples tested, are extremely concerning.”
According to the Veterinary Medicines Directorate (VMD), who funded the research, there are 66 licensed veterinary products containing fipronil in the UK, and 21 containing imidacloprid, either alone or in combination with other parasiticides. These include spot-on solutions, topical sprays and collars impregnated with the active ingredient.
While some of these products can be purchased only with a veterinary prescription, others can be bought without a prescription from pet shops, supermarkets, pharmacies and online. Many pet owners receive year-round preventative flea and/or tick treatment from their vet practice via healthcare plans.
Fipronil has a history of very limited agricultural use prior to its ban in 2017. It is also licensed for use in ant and cockroach baits, however only one product is licensed for use by non pest-control professionals. Use on pets seems to be the most plausible source of the widespread contamination of rivers.
The paper, co-authored with Martin Whitehead from the Chipping Norton Veterinary Hospital and Wayne Civil at the Environment Agency, examines the occurrence of fipronil and imidacloprid in English rivers as indicators of the potential contamination of waterways from the use of pet flea treatments.
They found that the average fipronil concentration across the rivers sampled by the Environment Agency exceeded chronic safety thresholds five-fold. The overall pollution levels in English rivers indicate that fipronil and its toxic breakdown products pose a high risk to aquatic ecosystems.
While, in most rivers, imidacloprid was found to pose a moderate risk, in seven out of the 20 rivers sampled there was a high environmental risk.
Co-author Professor Dave Goulson said “Fipronil and imidacloprid are both highly toxic to all insects and other aquatic invertebrates. Studies have shown both pesticides to be associated with declines in the abundance of aquatic invertebrate communities. The finding that our rivers are routinely and chronically contaminated with both of these chemicals and mixtures of their toxic breakdown products is deeply troubling.”
The paper, published in Science of the Total Environment, notes that the highest levels of pollution were found immediately downstream of wastewater treatment works, supporting the hypothesis that significant quantities of pesticide may be passing from treated pets to the environment via household drains.
Bathing of pets treated with spot-on fipronil flea products has been confirmed as a potentially important route to waterways for fipronil via sewers, and the washing of hands, pet bedding or other surfaces that have come into contact with treated pets are potential additional pathways for entry to sewers. Other pathways for contamination of waterways includes swimming and rainfall wash-off from treated pets. The strong correlation between fipronil and imidacloprid levels across the river sites tested suggest that they may be coming from a common source.
Rosemary Perkins added: “We’ve identified a number of steps that can be taken to minimise or avoid environmental harm from pet flea and/or tick treatments. These range from introducing stricter prescription-only regulations, to considering a more judicious and risk-based approach to the control of parasites in pets, for example by moving away from blanket year-round prophylactic use.
“We’d recommend a re-evaluation of the environmental risks posed by pet parasite products, and a reappraisal of the risk assessments that these products undergo prior to regulatory approval.”make a difference: sponsored opportunity
Story Source:
Materials provided by University of Sussex. Original written by Stephanie Allen. Note: Content may be edited for style and length.
Journal Reference:
Rosemary Perkins, Martin Whitehead, Wayne Civil, Dave Goulson. Potential role of veterinary flea products in widespread pesticide contamination of English rivers. Science of The Total Environment, 2020; 143560 DOI: 10.1016/j.scitotenv.2020.143560
FOR MORE INFORMATION: University of Sussex. “Pesticides commonly used as flea treatments for pets are contaminating English rivers: New research reveals widespread contamination, with two neurotoxic pesticides found in concentrations that far exceed accepted safe limits.” ScienceDaily. ScienceDaily, 17 November 2020. <www.sciencedaily.com/releases/2020/11/201117085940.htm>.
Biochar — a charcoal-like substance made primarily from agricultural waste products — holds promise for removing emerging contaminants such as pharmaceuticals from treated wastewater.
That’s the conclusion of a team of researchers that conducted a novel study that evaluated and compared the ability of biochar derived from two common leftover agricultural materials — cotton gin waste and guayule bagasse — to adsorb three common pharmaceutical compounds from an aqueous solution. In adsorption, one material, like a pharmaceutical compound, sticks to the surface of another, like the solid biochar particle. Conversely, in absorption, one material is taken internally into another; for example, a sponge absorbs water.
Guayule, a shrub that grows in the arid Southwest, provided the waste for one of the biochars tested in the research. More properly called Parthenium argentatum, it has been cultivated as a source of rubber and latex. The plant is chopped to the ground and its branches mashed up to extract the latex. The dry, pulpy, fibrous residue that remains after stalks are crushed to extract the latex is called bagasse.
The results are important, according to researcher Herschel Elliott, Penn State professor of agricultural and biological engineering, College of Agricultural Sciences, because they demonstrate the potential for biochar made from plentiful agricultural wastes — that otherwise must be disposed of — to serve as a low-cost additional treatment for reducing contaminants in treated wastewater used for irrigation.
“Most sewage treatment plants are currently not equipped to remove emerging contaminants such as pharmaceuticals, and if those toxic compounds can be removed by biochars, then wastewater can be recycled in irrigation systems,” he said. “That beneficial reuse is critical in regions such as the U.S. Southwest, where a lack of water hinders crop production.”
The pharmaceutical compounds used in the study to test whether the biochars would adsorb them from aqueous solution were: sulfapyridine, an antibacterial medication no longer prescribed for treatment of infections in humans but commonly used in veterinary medicine; docusate, widely used in medicines as a laxative and stool softener; and erythromycin, an antibiotic used to treat infections and acne.
The results, published today (Nov. 16) in Biochar, suggest biochars made from agricultural waste materials could act as effective adsorbents to remove pharmaceuticals from reclaimed water prior to irrigation. However, the biochar derived from cotton gin waste was much more efficient.
In the research, it adsorbed 98% of the docusate, 74% of the erythromycin and 70% of the sulfapyridine in aqueous solution. By comparison, the biochar derived from guayule bagasse adsorbed 50% of the docusate, 50% of the erythromycin and just 5% of the sulfapyridine.
The research revealed that a temperature increase, from about 650 to about 1,300 degrees F in the oxygen-free pyrolysis process used to convert the agricultural waste materials to biochars, resulted in a greatly enhanced capacity to adsorb the pharmaceutical compounds.
“The most innovative part about the research was the use of the guayule bagasse because there have been no previous studies on using that material to produce biochar for the removal of emerging contaminants,” said lead researcher Marlene Ndoun, a doctoral student in Penn State’s Department of Agricultural and Biological Engineering. “Same for cotton gin waste — research has been done on potential ways to remove other contaminants, but this is the first study to use cotton gin waste specifically to remove pharmaceuticals from water.”
For Ndoun, the research is more than theoretical. She said she wants to scale up the technology and make a difference in the world. Because cotton gin waste is widely available, even in the poorest regions, she believes it holds promise as a source of biochar to decontaminate water.
“I am originally from Cameroon, and the reason I’m even here is because I’m looking for ways to filter water in resource-limited communities, such as where I grew up,” she said. “We think if this could be scaled up, it would be ideal for use in countries in sub-Saharan Africa, where people don’t have access to sophisticated equipment to purify their water.”
The next step, Ndoun explained, would be to develop a mixture of biochar material capable of adsorbing a wide range of contaminants from water.
“Beyond removing emerging contaminants such as pharmaceuticals, I am interested in blending biochar materials so that we have low-cost filters able to remove the typical contaminants we find in water, such as bacteria and organic matter,” said Ndoun.make a difference: sponsored opportunity
Story Source:
Materials provided by Penn State. Original written by Jeff Mulhollem. Note: Content may be edited for style and length.
Journal Reference:
Marlene C. Ndoun, Herschel A. Elliott, Heather E. Preisendanz, Clinton F. Williams, Allan Knopf, John E. Watson. Adsorption of pharmaceuticals from aqueous solutions using biochar derived from cotton gin waste and guayule bagasse. Biochar, 2020; DOI: 10.1007/s42773-020-00070-2
FOR MORE INFORMATION: Penn State. “Biochar from agricultural waste products can adsorb contaminants in wastewater.” ScienceDaily. ScienceDaily, 16 November 2020. <www.sciencedaily.com/releases/2020/11/201116161228.htm>.
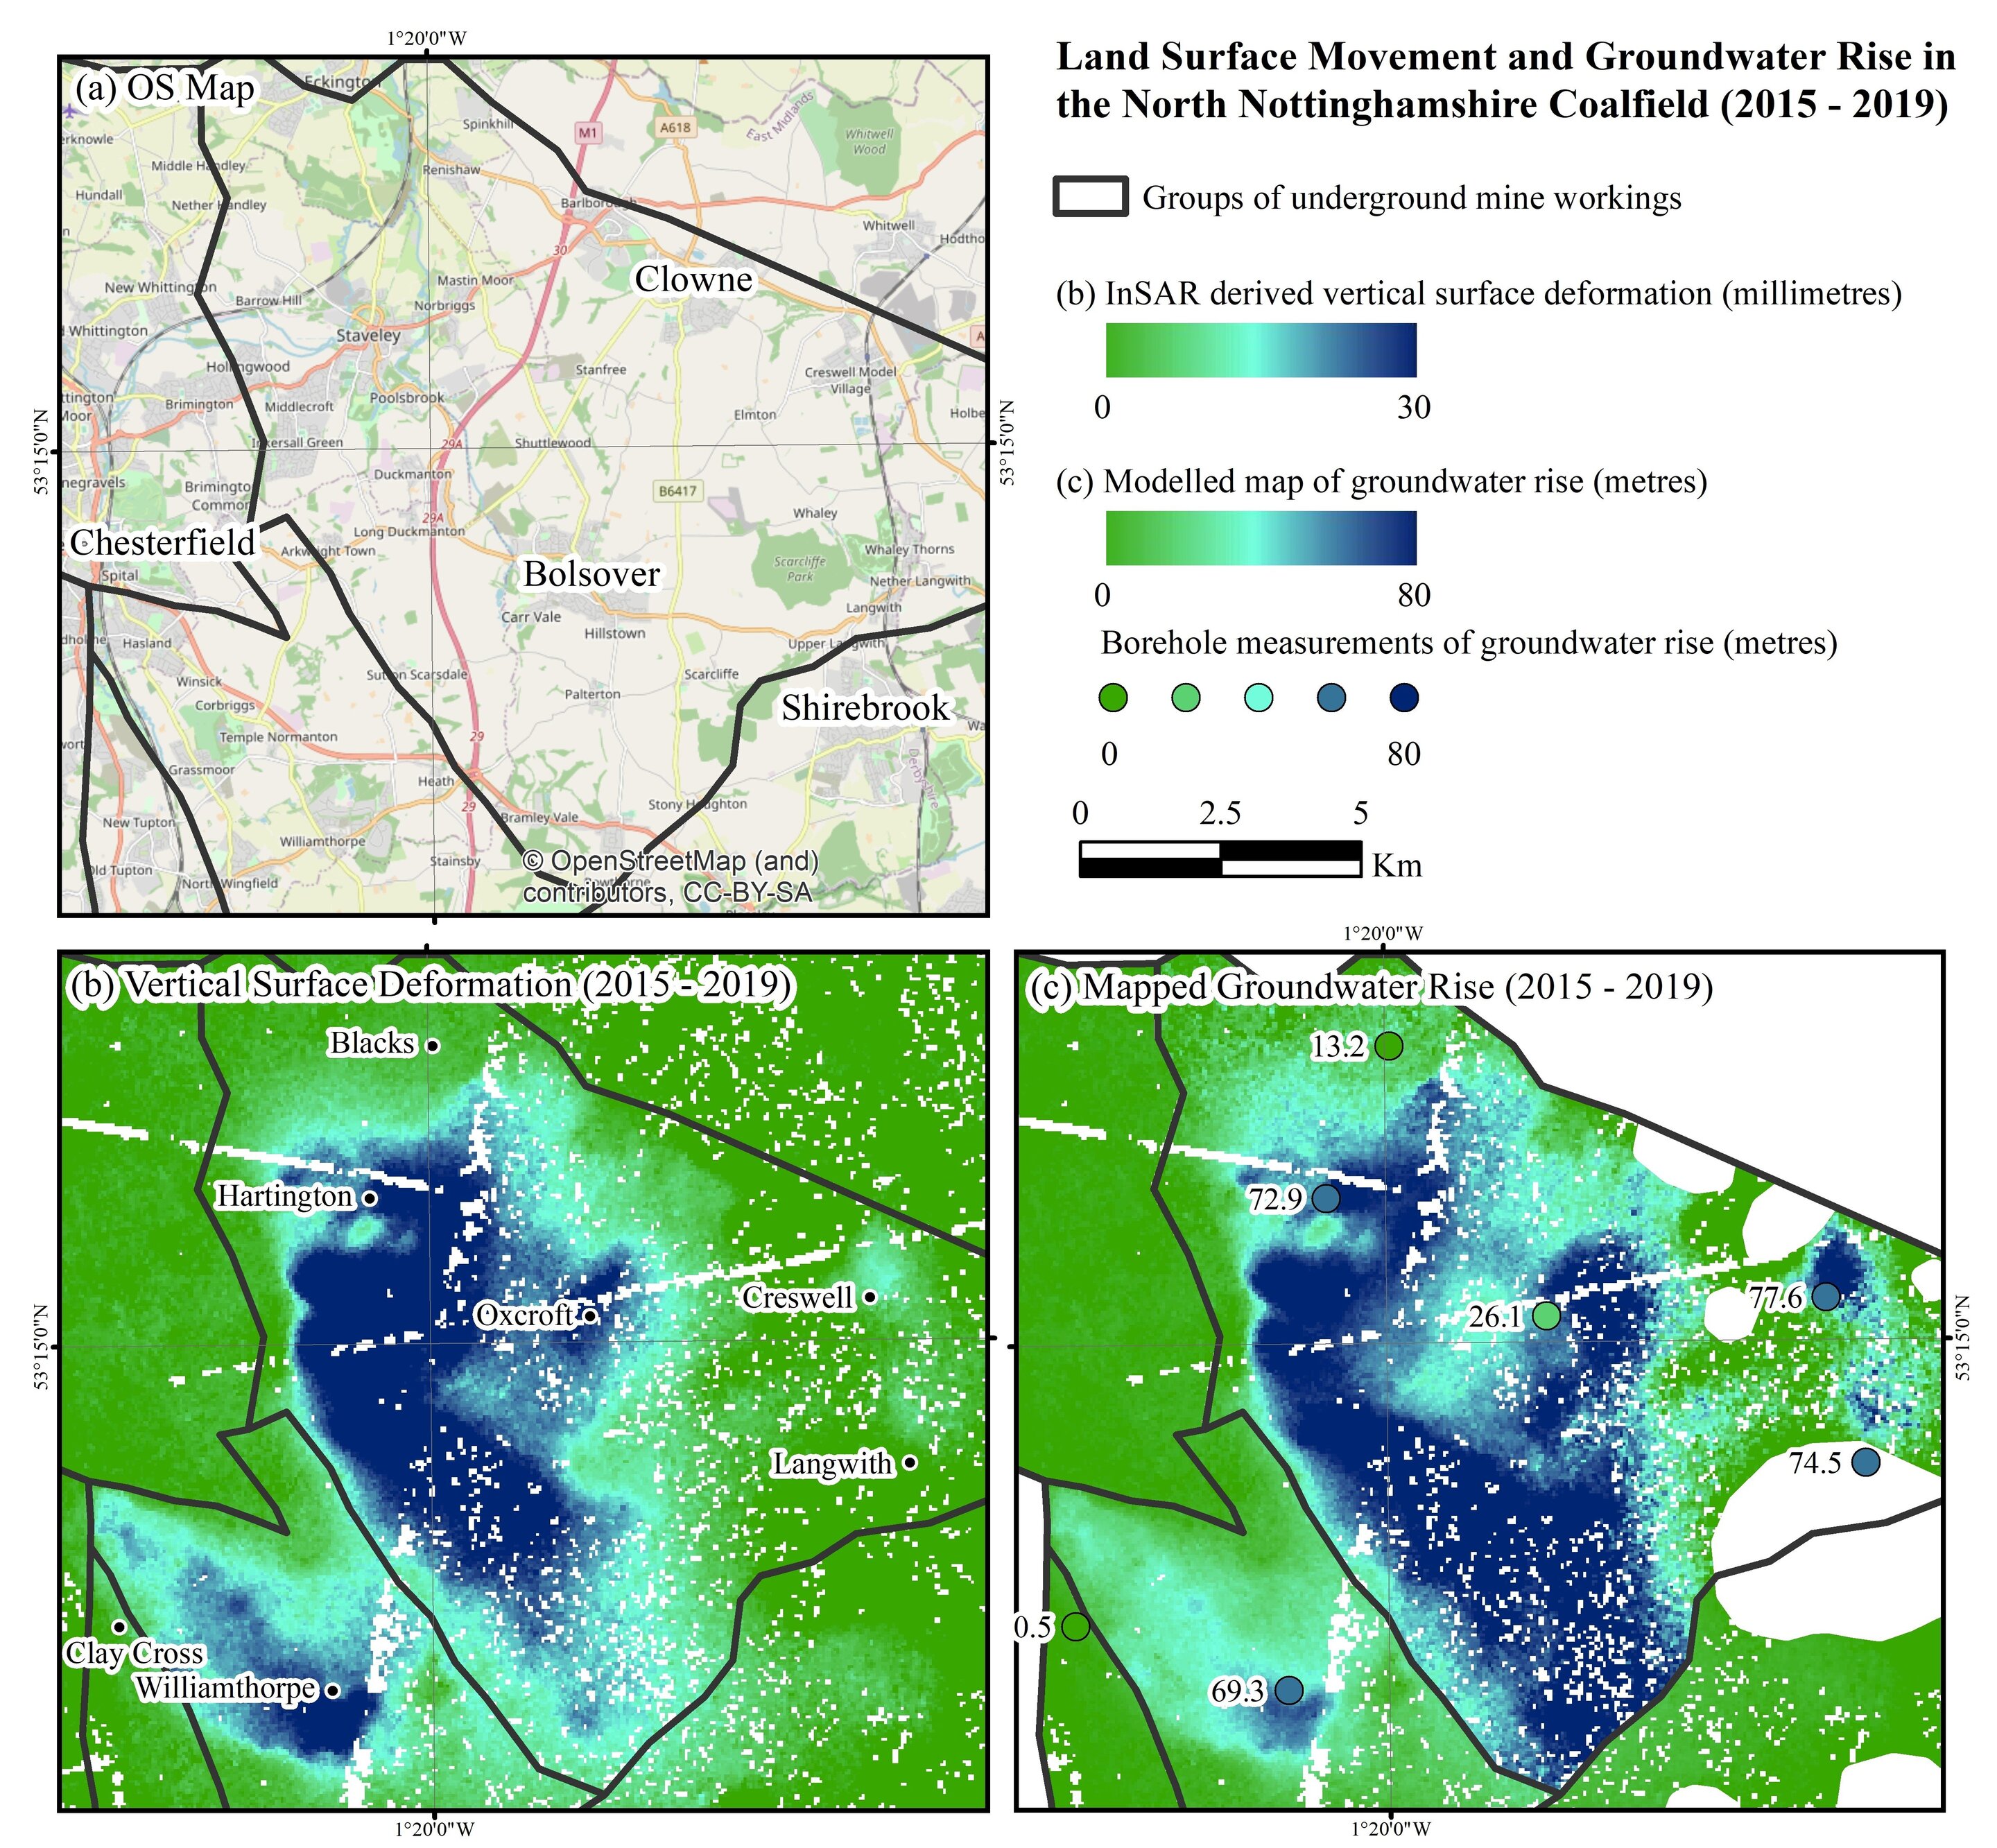
A remote monitoring tool to help authorities manage public safety and environmental issues in recently abandoned coal mines has been developed by the University of Nottingham.
The tool uses satellite radar imagery to capture millimetre-scale measurements of changes in terrain height. Such measurements can be used to monitor and forecast groundwater levels and changes in geological conditions deep below the earth’s surface in former mining areas.
With a long history of coal mining, the project was tested in the UK at a regional scale, but has global implications given the worldwide decline in the demand for coal in favour of more sustainable energy sources.
The method was implemented over the Nottinghamshire coalfields, which were abandoned as recently as 2015, when the last deep mine, Thoresby Colliery, shut its doors for good.
When deep mines are closed, the groundwater that was previously pumped to the surface to make mining safe, is allowed to rise again until it is restored to its natural level in a process called rebound.
The rebound of groundwater through former mine workings needs careful monitoring; often containing contaminants it can pollute waterways and drinking water supplies; lead to localised flooding; renew mining subsidence, land uplift and reactivate geological faults if it rises too fast. Such issues can cause costly and hazardous problems that need to be addressed prior to the land being repurposed.
The Coal Authority therefore needs detailed information on the rebound rate across the vast mine systems it manages so it knows exactly where to relax or increase pumping to control groundwater levels.
Measuring the rate and location of mine water rebound is therefore vital to effectively manage the environmental and safety risks in former coalfields, but difficult to achieve. Groundwater can flow in unanticipated directions via cavities within and between neighbouring collieries and discharge at the surface in areas not thought to be at risk.
In the past, predicting where mine water will flow was heavily-reliant on mine plans; inaccurate or incomplete documents that are sometimes more than a century old; and borehole data. Costing approximately £20,000 to £350K each, boreholes are expensive to drill and are often sparsely situated across vast coalfields, leaving measurement gaps.
More recently uplift, subsidence and other geological motion has been monitored by applying Interferometric Synthetic Aperture Radar (InSAR) to images acquired from radar satellites. However, this interferometry technique has historically worked only in urban areas (as opposed to rural ones), where the radar can pick up stable objects, such as buildings or rail tracks, on the ground to reflect back regularly to the satellite.
This study uses an advanced InSAR technique, called Intermittent Small Baseline Subset (ISBAS), developed by the University of Nottingham and its spin-out company Terra Motion Ltd. InSAR uses stacks of satellite images of the same location taken every few days or weeks which makes it possible to pick up even the slightest topographical changes over time. Uniquely, ISBAS InSAR can compute land deformation measurements over both urban and rural terrain. This is beneficial when mapping former mining areas, which are often located in rural areas. Over the Nottinghamshire coalfields, for example, the land cover is predominantly rural, with nearly 80 per cent comprising agricultural land, pastures and semi-natural areas.
Such a density of measurements meant study lead, University of Nottingham PhD student David Gee could develop a cost-effective and simple method to model groundwater rebound from the surface movement changes.
The study found a definitive link between ground motion measurements and rising mine water levels. Often land subsidence or uplift occurs as a result of changes in groundwater, where the strata acts a little like a sponge, expanding when filling with fluid and contracting when drained.
With near-complete spatial coverage of the InSAR data, he could fill in the measurement gaps between boreholes to map the change in mine water levels across the whole coalfield. The model takes into account both geology and depth of groundwater to determine the true rate of rebound and help identify where problems associated with rebound may occur.
The findings have been published in a paper ‘Modelling groundwater rebound in recently abandoned coalfields using DInSAR’ in the journal Remote Sensing of Environment.
David Gee, who is based in the Nottingham Geospatial Institute at the University, said, “There are several coalfields currently undergoing mine water rebound in the UK, where surface uplift has been measured using InSAR. In the Nottinghamshire coalfields, the quantitative comparison between the deformation measured by the model and InSAR confirms that the heave is caused by the recovery of mine water.”
At first a forward model was generated to estimate surface uplift in response to measured changes in groundwater levels from monitoring boreholes. David calibrated and validated the model using ISBAS InSAR on ENVISAT and Sentinel-1 radar data. He then inverted the InSAR measurements to provide an estimate of the change in groundwater levels. Subsequently, the inverted rates were used to estimate the time it will take for groundwater to rebound and identify areas of the coalfield most at risk of surface discharges.
“InSAR measurements, when combined with modelling, can assist with the characterisation of the hydrogeological processes occurring at former mining sites. The technique has the potential to make a significant contribution to the progressive abandonment strategy of recently closed coalfields,” David said.
The InSAR findings offer a supplementary source of data on groundwater changes that augment the borehole measurements. It means monitoring can be done remotely so is less labour-intensive for national bodies such as the Environment Agency (which manages hazards such as flooding, pollution and contaminated land) and the Coal Authority (which has a mandate to manage the legacy of underground coal mining in terms of public safety and subsidence).
The model has already flagged that some parts of the coal fields that are not behaving as previously predicted, which could influence existing remediation plans.
David explains, “The deepest part of the North Nottinghamshire coalfield, for example, is not rebounding as expected which suggests that the mine plans here might not be completely accurate. The stability is confirmed by the InSAR and the model — future monitoring of this area will help to identify if or when rebound does eventually occur.
“Next steps for the project are to integrate our results into an existing screening tool developed by the Environment Agency and Coal Authority to help local planning authorities, developers and consultants design sustainable drainage systems in coalfield areas. The initial results, generated at a regional scale, have the potential to be scaled to all coalfields in the UK, with the aid of national InSAR maps,” adds David.
Luke Bateson, Senior Remote Sensing Geologist from the British Geological Survey, said, “InSAR data offers a fantastic opportunity to reveal how the ground is moving, however we need studies such as David’s in order to understand what these ground motions relate to and what they mean. David’s study, not only provides this understanding but also provides a tool which can convert InSAR ground motions into information on mine water levels that can be used to make informed decisions.”
Dr Andrew Sowter, Chief Technical Officer at Terra Motion Ltd, explains, “Studies like this demonstrate the value to us, as a small commercial company, in investing in collaborative work with the University. We now have a remarkable, validated, result that is based upon our ISBAS InSAR method and demonstrably supported by a range of important stakeholders. This will enable us to further penetrate the market in a huge range of critical applications hitherto labelled as difficult for more conventional InSAR techniques, particularly those markets relating to underground fluid extraction and injection in more temperate, vegetated zones.”make a difference: sponsored opportunity
David Gee, Luke Bateson, Stephen Grebby, Alessandro Novellino, Andrew Sowter, Lee Wyatt, Stuart Marsh, Roy Morgenstern, Ahmed Athab. Modelling groundwater rebound in recently abandoned coalfields using DInSAR. Remote Sensing of Environment, 2020; 249: 112021 DOI: 10.1016/j.rse.2020.112021
FOR MORE INFORMATION: University of Nottingham. “New tool predicts geological movement and the flow of groundwater in old coalfields.” ScienceDaily. ScienceDaily, 16 November 2020. <www.sciencedaily.com/releases/2020/11/201116112934.htm>.
Today, the lakes around Cape Town are brimming with water, but it was only a few years ago that South Africa’s second-most populous city made global headlines as a multi-year drought depleted its reservoirs, impacting millions of people. That kind of extreme event may become the norm, researchers now warn.
Using new high-resolution simulations, researchers from Stanford University and the National Oceanic and Atmospheric Administration (NOAA) concluded that human-caused climate change made the “Day Zero” drought in southwestern South Africa — named after the day, barely averted, when Cape Town’s municipal water supply would need to be shut off — five to six times more likely. Furthermore, such extreme events could go from being rare to common events by the end of the century, according to the study, published November 9 in the journal Proceedings of the National Academy of Sciences.
“In a way, the ‘Day Zero’ drought might have been a sort of taste of what the future may be,” said lead author Salvatore Pascale, a research scientist at Stanford’s School of Earth, Energy & Environmental Sciences (Stanford Earth). “In the worst-case scenario, events like the ‘Day Zero’ drought may become about 100 times more likely than what they were in the early 20th-century world.”
Factoring multiple climate scenarios
Using a climate modeling system known as the Seamless System for Prediction and EArth System Research (SPEAR), the researchers simulated the response of atmospheric circulation patterns to increasing levels of carbon dioxide.
The model found that in a high greenhouse gas-emissions scenario, a devastating drought like the one that crippled Cape Town could impact the region two or three times in a decade. Even in an intermediate-emissions scenario, the risk of multi-year droughts that are more extreme and last longer than the “Day Zero” drought will increase by the end of the century.
The new research uses higher resolution models than were previously available and supports the conclusions of past studies that projected an increase in drought risk. The findings underscore the area’s sensitivity to further emissions and need for aggressive water management.
“The information we can provide now with these new tools is much more precise,” Pascale said. “We can say with a higher degree of confidence that the role anthropogenic climate change has had so far has been quite large.”
Preparing for the future
Other parts of the world with similar climates to South Africa — including California, southern Australia, southern Europe and parts of South America — could experience their own Zero Day droughts in the future, according to the researchers. “Analysis like this should be conducted for thorough water risk management,” said co-author Sarah Kapnick, a research physical scientist and deputy division leader at NOAA’s Geophysical Fluid Dynamics Laboratory.
“Given the dramatic shift in multi-year drought risk, this work also serves as an example for other regions to explore their changing drought risks,” Kapnick said. “Emerging drought risks may not be on the radar of managers in other regions in the world who have not experienced a recent rare drought event.”
Meteorological droughts, or rainfall deficits, like the one that affected Cape Town have high societal and economic impacts. According to estimates, lower crop yields from the “Day Zero” drought caused an economic loss of about $400 million, in addition to tens of thousands of jobs.
“This study shows these events will be more likely in the future depending on how energetic we are in addressing the climate problem,” Pascale said. “It can be either catastrophic or just a little bit better, but still worse than what it is now — this is trying to give some indication about what the future might look like.”
Three consecutive years of dry winters from 2015-17 in southwestern South Africa led to the severe water shortage from 2017-18. Cape Town never actually reach “Day Zero,” in part because authorities implemented water restrictions throughout the period, banning outdoor and non-essential water use, encouraging toilet flushing with grey water and eventually limiting consumption to about 13 gallons per person in February 2018. That level of conservation was foreign to many residents of the coastal tourist destination and would likely be jarring to many in the U.S., where the average person goes through 80 to 100 gallons per day, according to the United States Geological Survey (USGS).
“I’m sure that many Cape Town residents have forgotten what happened now that lakes and water reservoirs are back to normal,” Pascale said. “But this is the moment to rethink the old way of managing water for a future when there will be less water available.”
Thomas Delworth and William Cooke from NOAA are co-authors on the study.
The research was supported by NOAA and Stanford University.make a difference: sponsored opportunity
Story Source:
Materials provided by Stanford University. Original written by Danielle Torrent Tucker. Note: Content may be edited for style and length.
Journal Reference:
Salvatore Pascale, Sarah B. Kapnick, Thomas L. Delworth, William F. Cooke. Increasing risk of another Cape Town “Day Zero” drought in the 21st century. Proceedings of the National Academy of Sciences, 2020; 202009144 DOI: 10.1073/pnas.2009144117
FOR MORE INFORMATION: Stanford University. “In a warming world, Cape Town’s ‘Day Zero’ drought won’t be an anomaly.” ScienceDaily. ScienceDaily, 9 November 2020. <www.sciencedaily.com/releases/2020/11/201109152241.htm>.